Who gets credit for the sale?
Marketers know all too well the pain of defining what makes a lead qualified and how to attribute credit for that qualified lead. And at Drift we’re no different. So, we decided to build a solution that would help resolve the issues of attribution and while also allowing you to track your revenue from the top to the bottom of your funnel.
The new Drift reporting is based on revenue – a metric that sales and marketing can both align around. And you can choose the level of depth you want out of your reporting. Whether that’s a high-level overview that allows you to measure day-to-day performance or more in-depth reporting that lets you see how Drift is working for you.
Here’s what you can expect with new reporting in Drift.
The Salesforce Revenue Dashboard
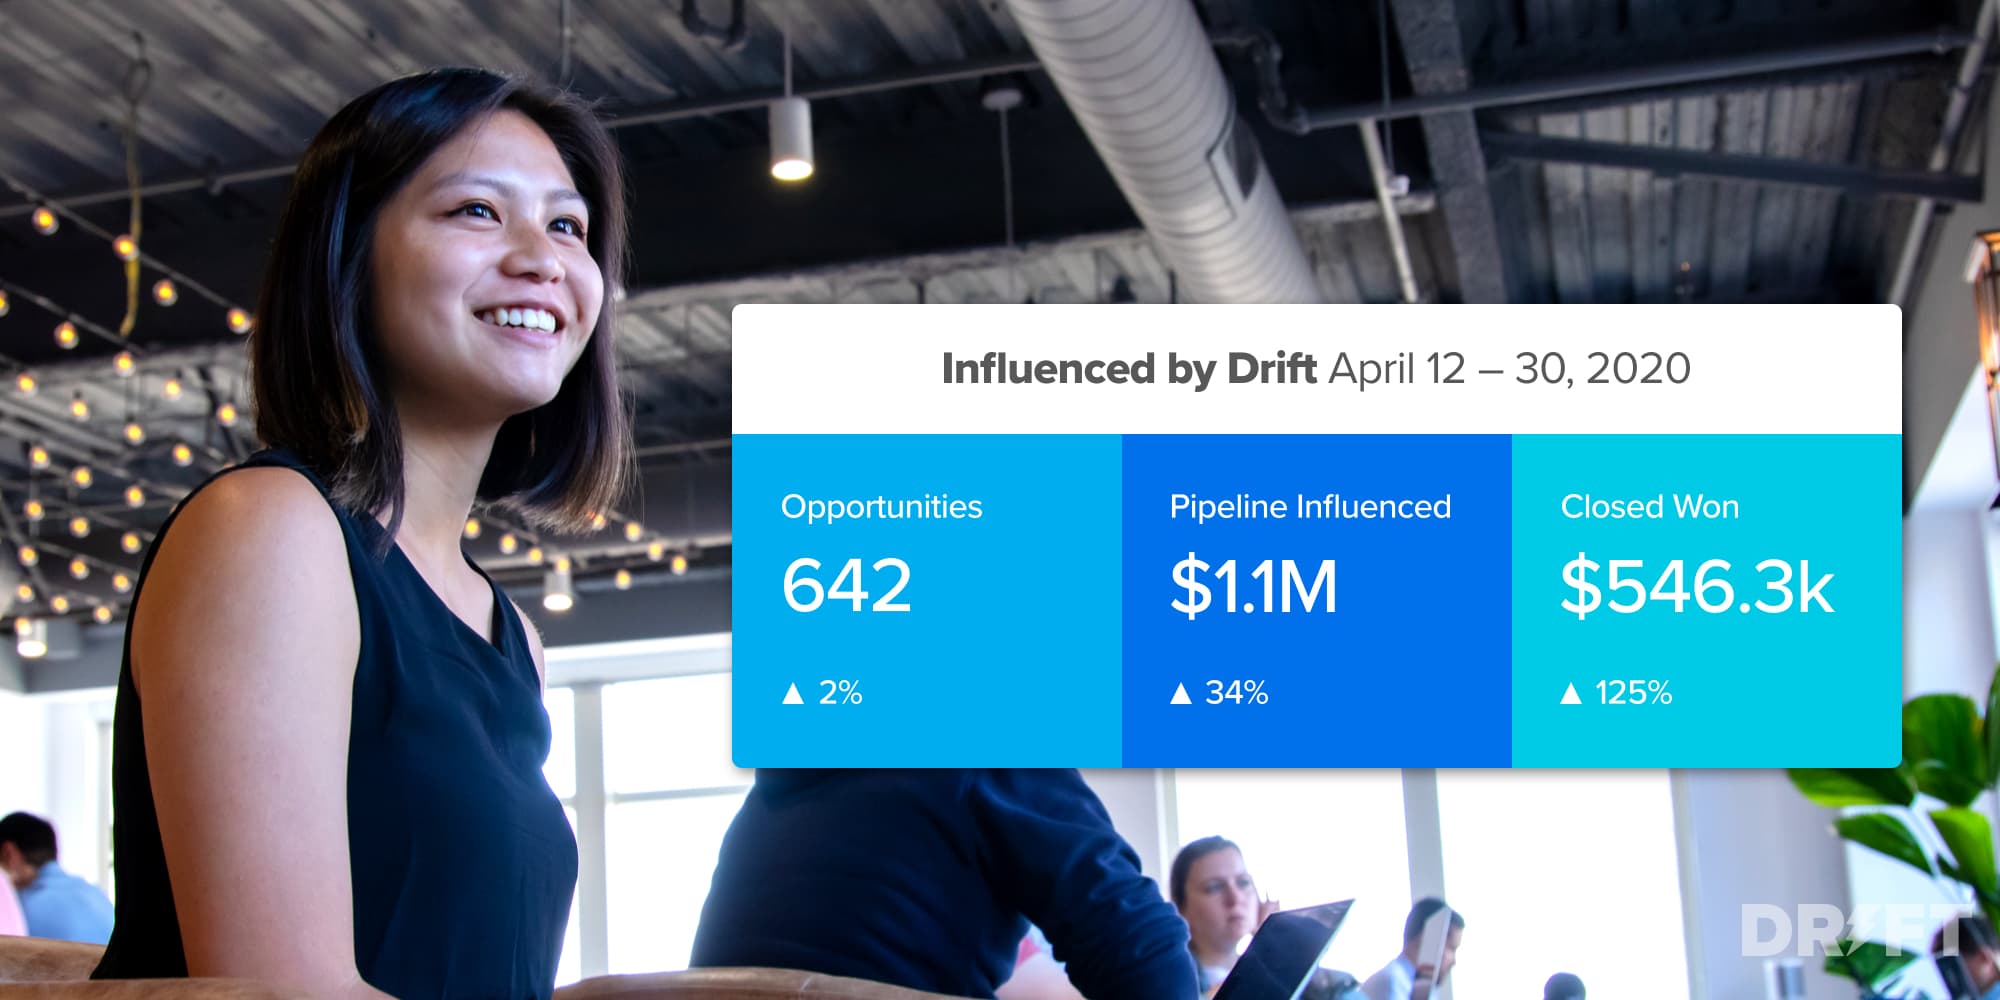
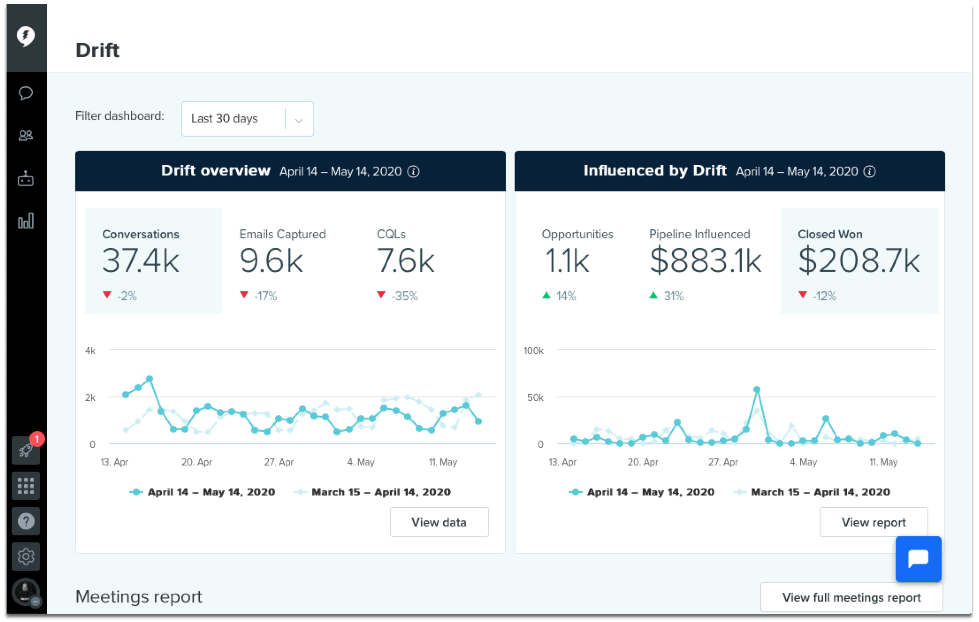
The dashboard located on the home screen gives you an at-a-glance look at key revenue metrics: opportunities, pipeline and closed won dollars influenced by Drift.
Don’t see this data? The first step to ensuring you have actionable data is to enable your Salesforce integration. Once you have set up the integration, you can toggle on the dashboard under settings.
To get the most of out of this dashboard, let’s start by understanding what each metric means:
- Opportunities refer to the number of sales and pending deals that were influenced by Drift
- Pipeline Influenced is the sum of revenue attached to the Opportunities which were influenced by Drift
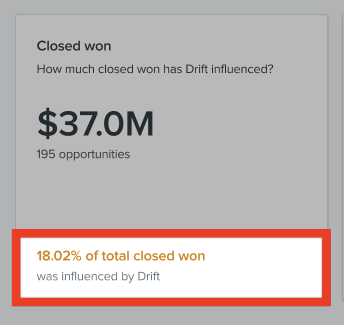
- Closed Won is the total revenue from deals marked as closed-won in Salesforce that were influenced by Drift
You can use the date picker on the top left to filter down to a particular date range. The report will update to show you the data for that range and also provide a point of comparison for the prior time period. Hovering over a data point on the graph will give you the closed won revenue for that date.
This report is more high-level and lets you put a finger on the pulse of how Drift is impacting your business. But, let’s dive a little deeper with the Overview report.
The Overview Report
The Overview report shows all of your revenue metrics and top deals on one page. It lets you get a little deeper than the Salesforce Dashboard and serves as a map for the business metrics, such as sales cycle and pipeline amount, that you might want to explore further.
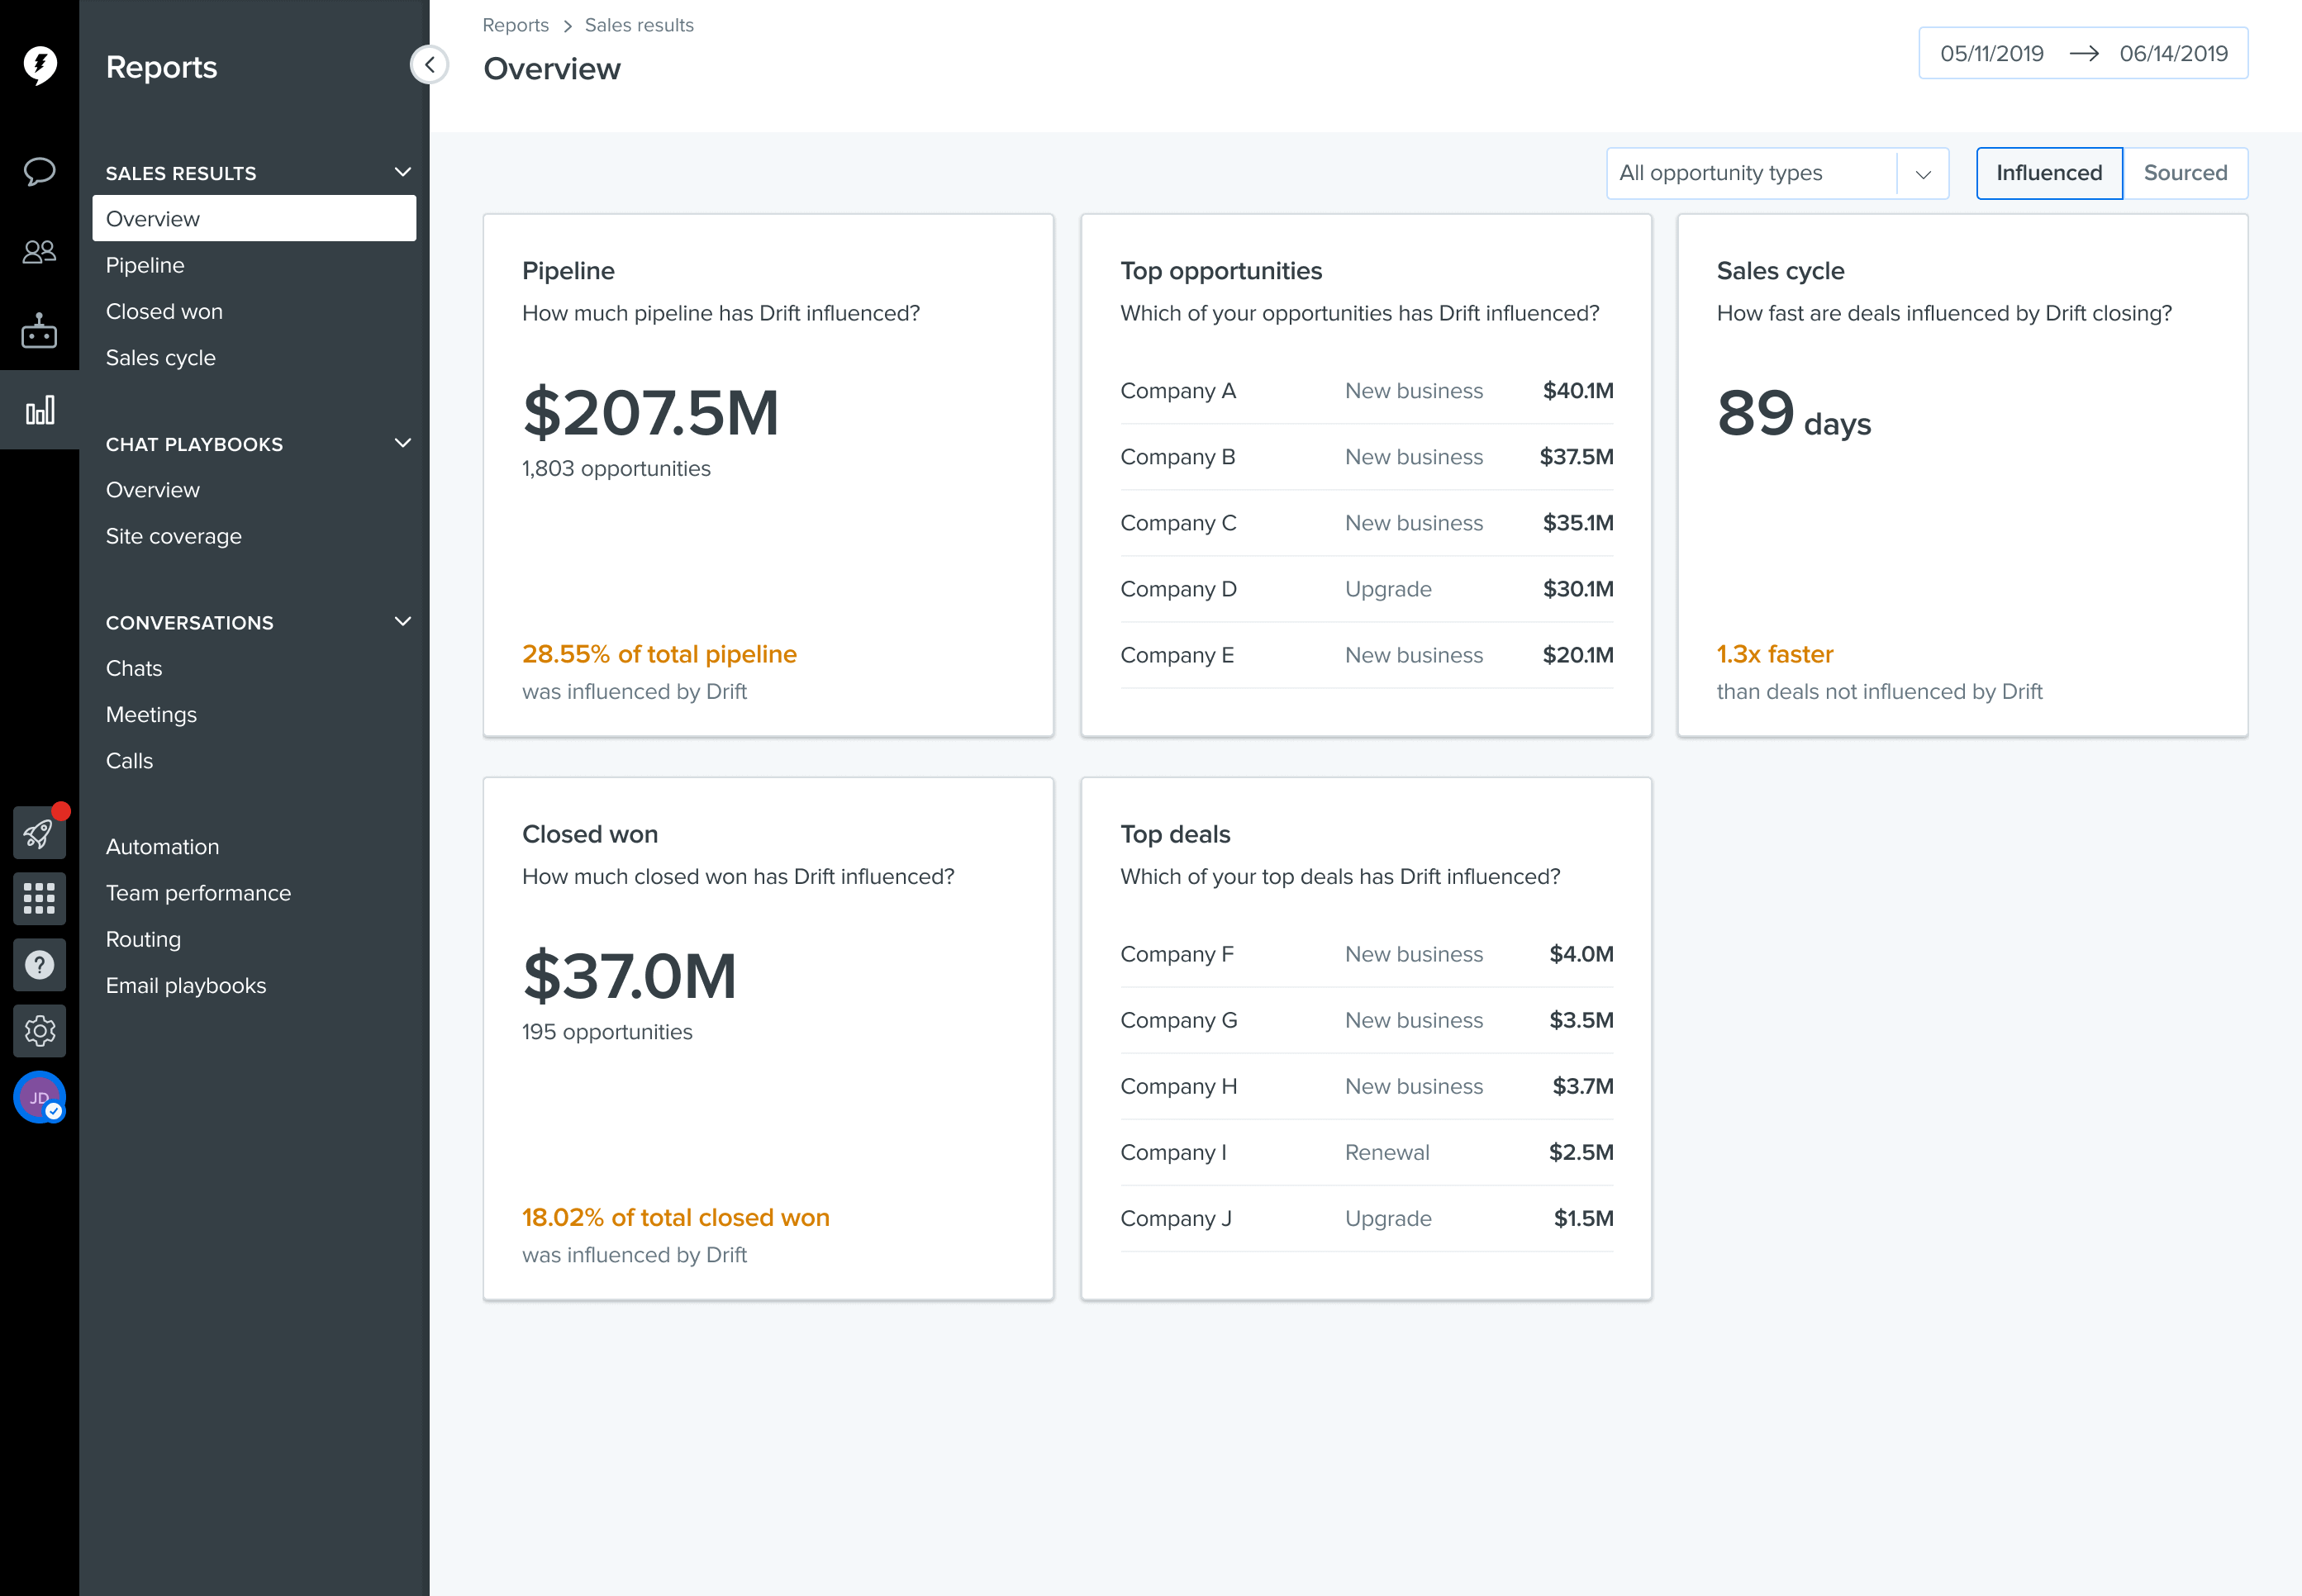
There are a couple of ways you can review the data displayed in this report: by “influenced” or “sourced.” “Influenced” means that someone at that company interacted with you via Drift and “sourced” means that the first interaction that company had with yours came from Drift. You can toggle back and forth between these using the slider on the top right.
The data available to you includes:
- Pipeline: As mentioned above, this shows you the total amount of the potential deals and opportunities
- Top opportunities: This list is ordered by the revenue each deal might add to your business
- Length of the sales cycle: This shows you how quickly Drift is helping you close deals and accelerate revenue
- Closed won amount: The total amount of revenue Drift has helped you close
- Top deals: The biggest deals by revenue that Drift has helped close
At the bottom of the cards for pipeline, closed won, and sales cycle, you can see how Drift compares to the overall total for each metric.
As with other Drift reports, you can use the date picker to view reporting for a particular time period.
From the Overview report, you can pick the next metric you want to explore: Drift provides more in-depth reporting for pipeline, revenue, and sales cycle.
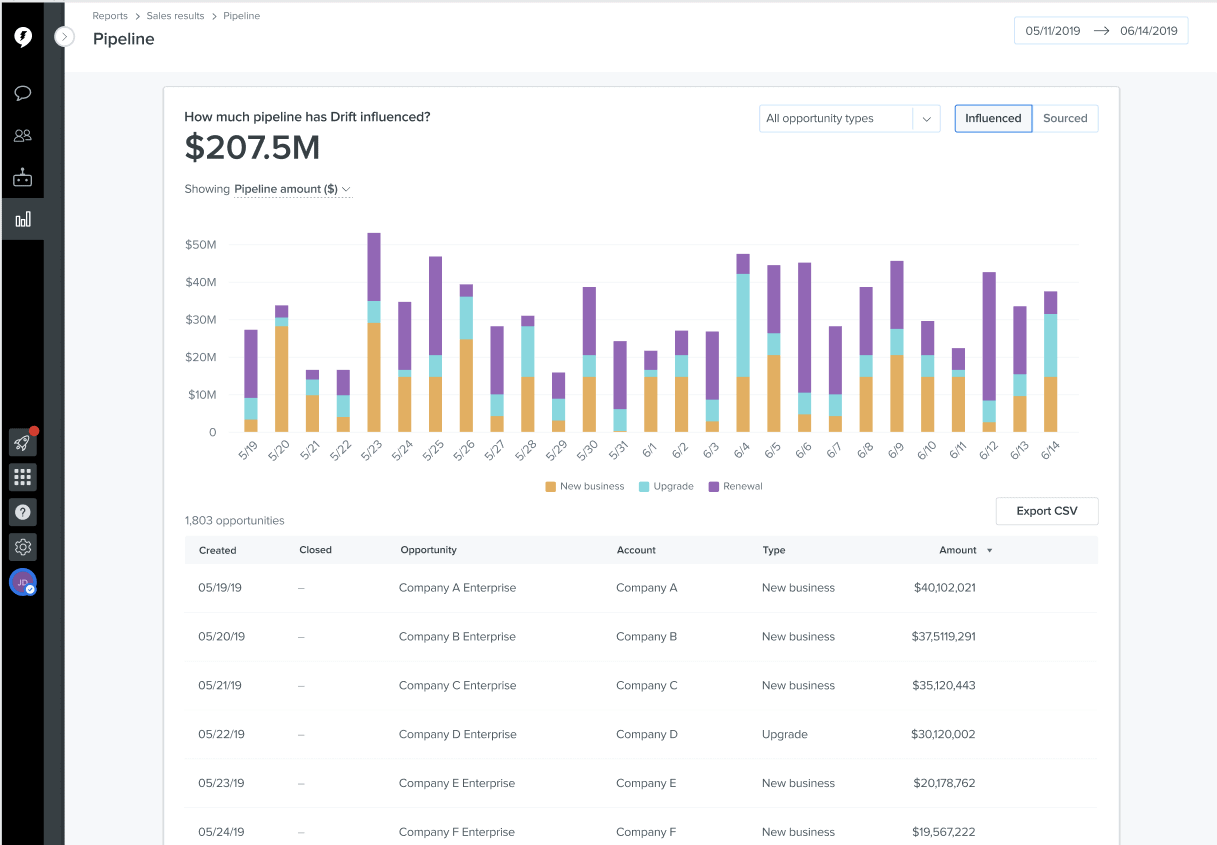
The Pipeline Report
The Pipeline report shows you how much potential revenue Drift has helped to influence for your business. At the top is a graph that tracks this metric over time and, below that, a list of opportunities that contributed to it.
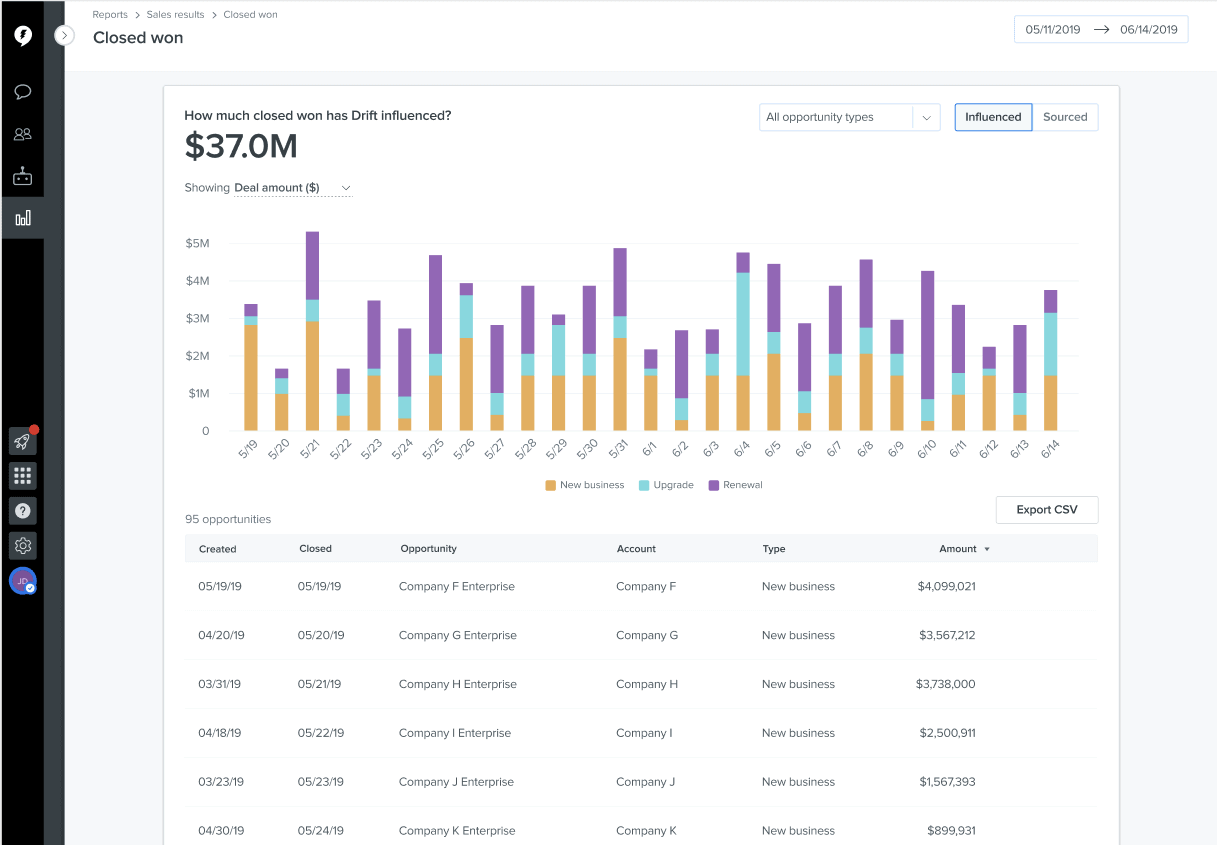
The Closed Won Report
The Closed Won report shows you how much revenue Drift has helped you close over time. This report, along with the Pipeline report, can be exported for more in-depth analysis.
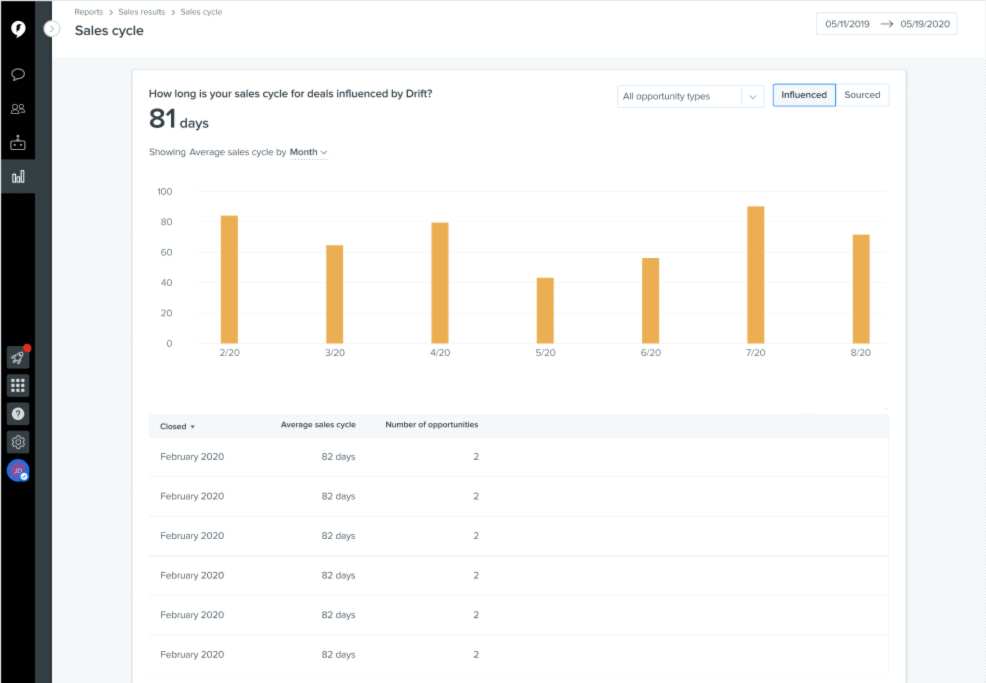
The Sales Cycle Report
The Sales Cycle report shows you the average number days between when a Drift-influenced or sourced opportunity was created and when the deal closed. This can help you understand how quickly you’re moving revenue down the funnel with Drift.
All three of these reports can be toggled between “influenced” and “sourced” and filtered by opportunity type – for example, “new business” or “expansion.”
The reporting available in Drift is designed to help you understand how Drift is impacting your business – all the way from the first conversation to the deal closing. For in-depth insights and to get the most out of this new reporting, we recommend connecting Drift with Salesforce. You can learn how to do that here.
Want to learn how to set up reporting for your business from the operations experts at Drift? Check out this class from Drift Insider. PS: it’s free!