
Today I want to talk to you about performance and our system for getting things done.
Here on Drift’s product team, after determining what we want to complete – the mission – we go one step deeper by considering the following questions: How does someone show where they are in the process of completing their goal? How does someone know if they are on track vs. expectations?
You might be thinking – there’s already a system for that. And there is. OKRs (objectives and key results) are a framework for defining and tracking objectives and their outcomes.
Want to learn more about OKRs? Tune into these two episodes of Build, where host Maggie Crowley sits down with OKR legends Deidre Paknad and Christina Wodtke.
Our system was inspired by OKRs, but it is much more than that.
We call it Motion: The Drift Performance System, and it’s a complete toolkit that helps individuals and teams describe what they want to accomplish, articulate a clear action plan, and show complete visibility along the way.
Ready to get started? Download the templates our teams use to get things done right here.
Motion: The Drift Performance System provides a scalable system that clearly lays out any goal (personal or professional) and helps individuals break down the completion process into smaller steps. Going one step further, using this system allows an individual to do something that we live by here at Drift: SHOW YOUR WORK.
By showing your work throughout the entire process, individuals gain an understanding of where things may be going wrong, which then allows them to course-correct much faster. Teams get to see all of the inputs. Leadership at all levels can easily check-in for updates on what’s happening. And projects, in particular those that run on a quarterly cadence, improve with each run.
Any level of increased visibility speeds up process velocity. This system, once you nail it down, helps you move faster because you spend less time figuring out what happened and more time moving forward. As Maggie Crowley (Drift’s Director of Product Management and former Olympic speedskater) likes to say, you can skate faster when your eyes are forward.
We build products in a hypergrowth startup, which means we do many things that don’t scale. But by using our system, we’ve started to lay the foundation for sustained growth. Here’s a breakdown of how the system works:
The Motion: Drift Performance System is a framework designed to empower leaders to better design, manage, and complete initiatives within an organization. The four primary pieces of this framework break off into two parts: planning and visibility.
- Goals (planning)
- Grids (visibility)
- Milestones (planning)
- Motions (visibility)
That’s the overview. Now let’s dig into the tools – what they are and how you can use them.
Tool #1 – Setting Clear Goals
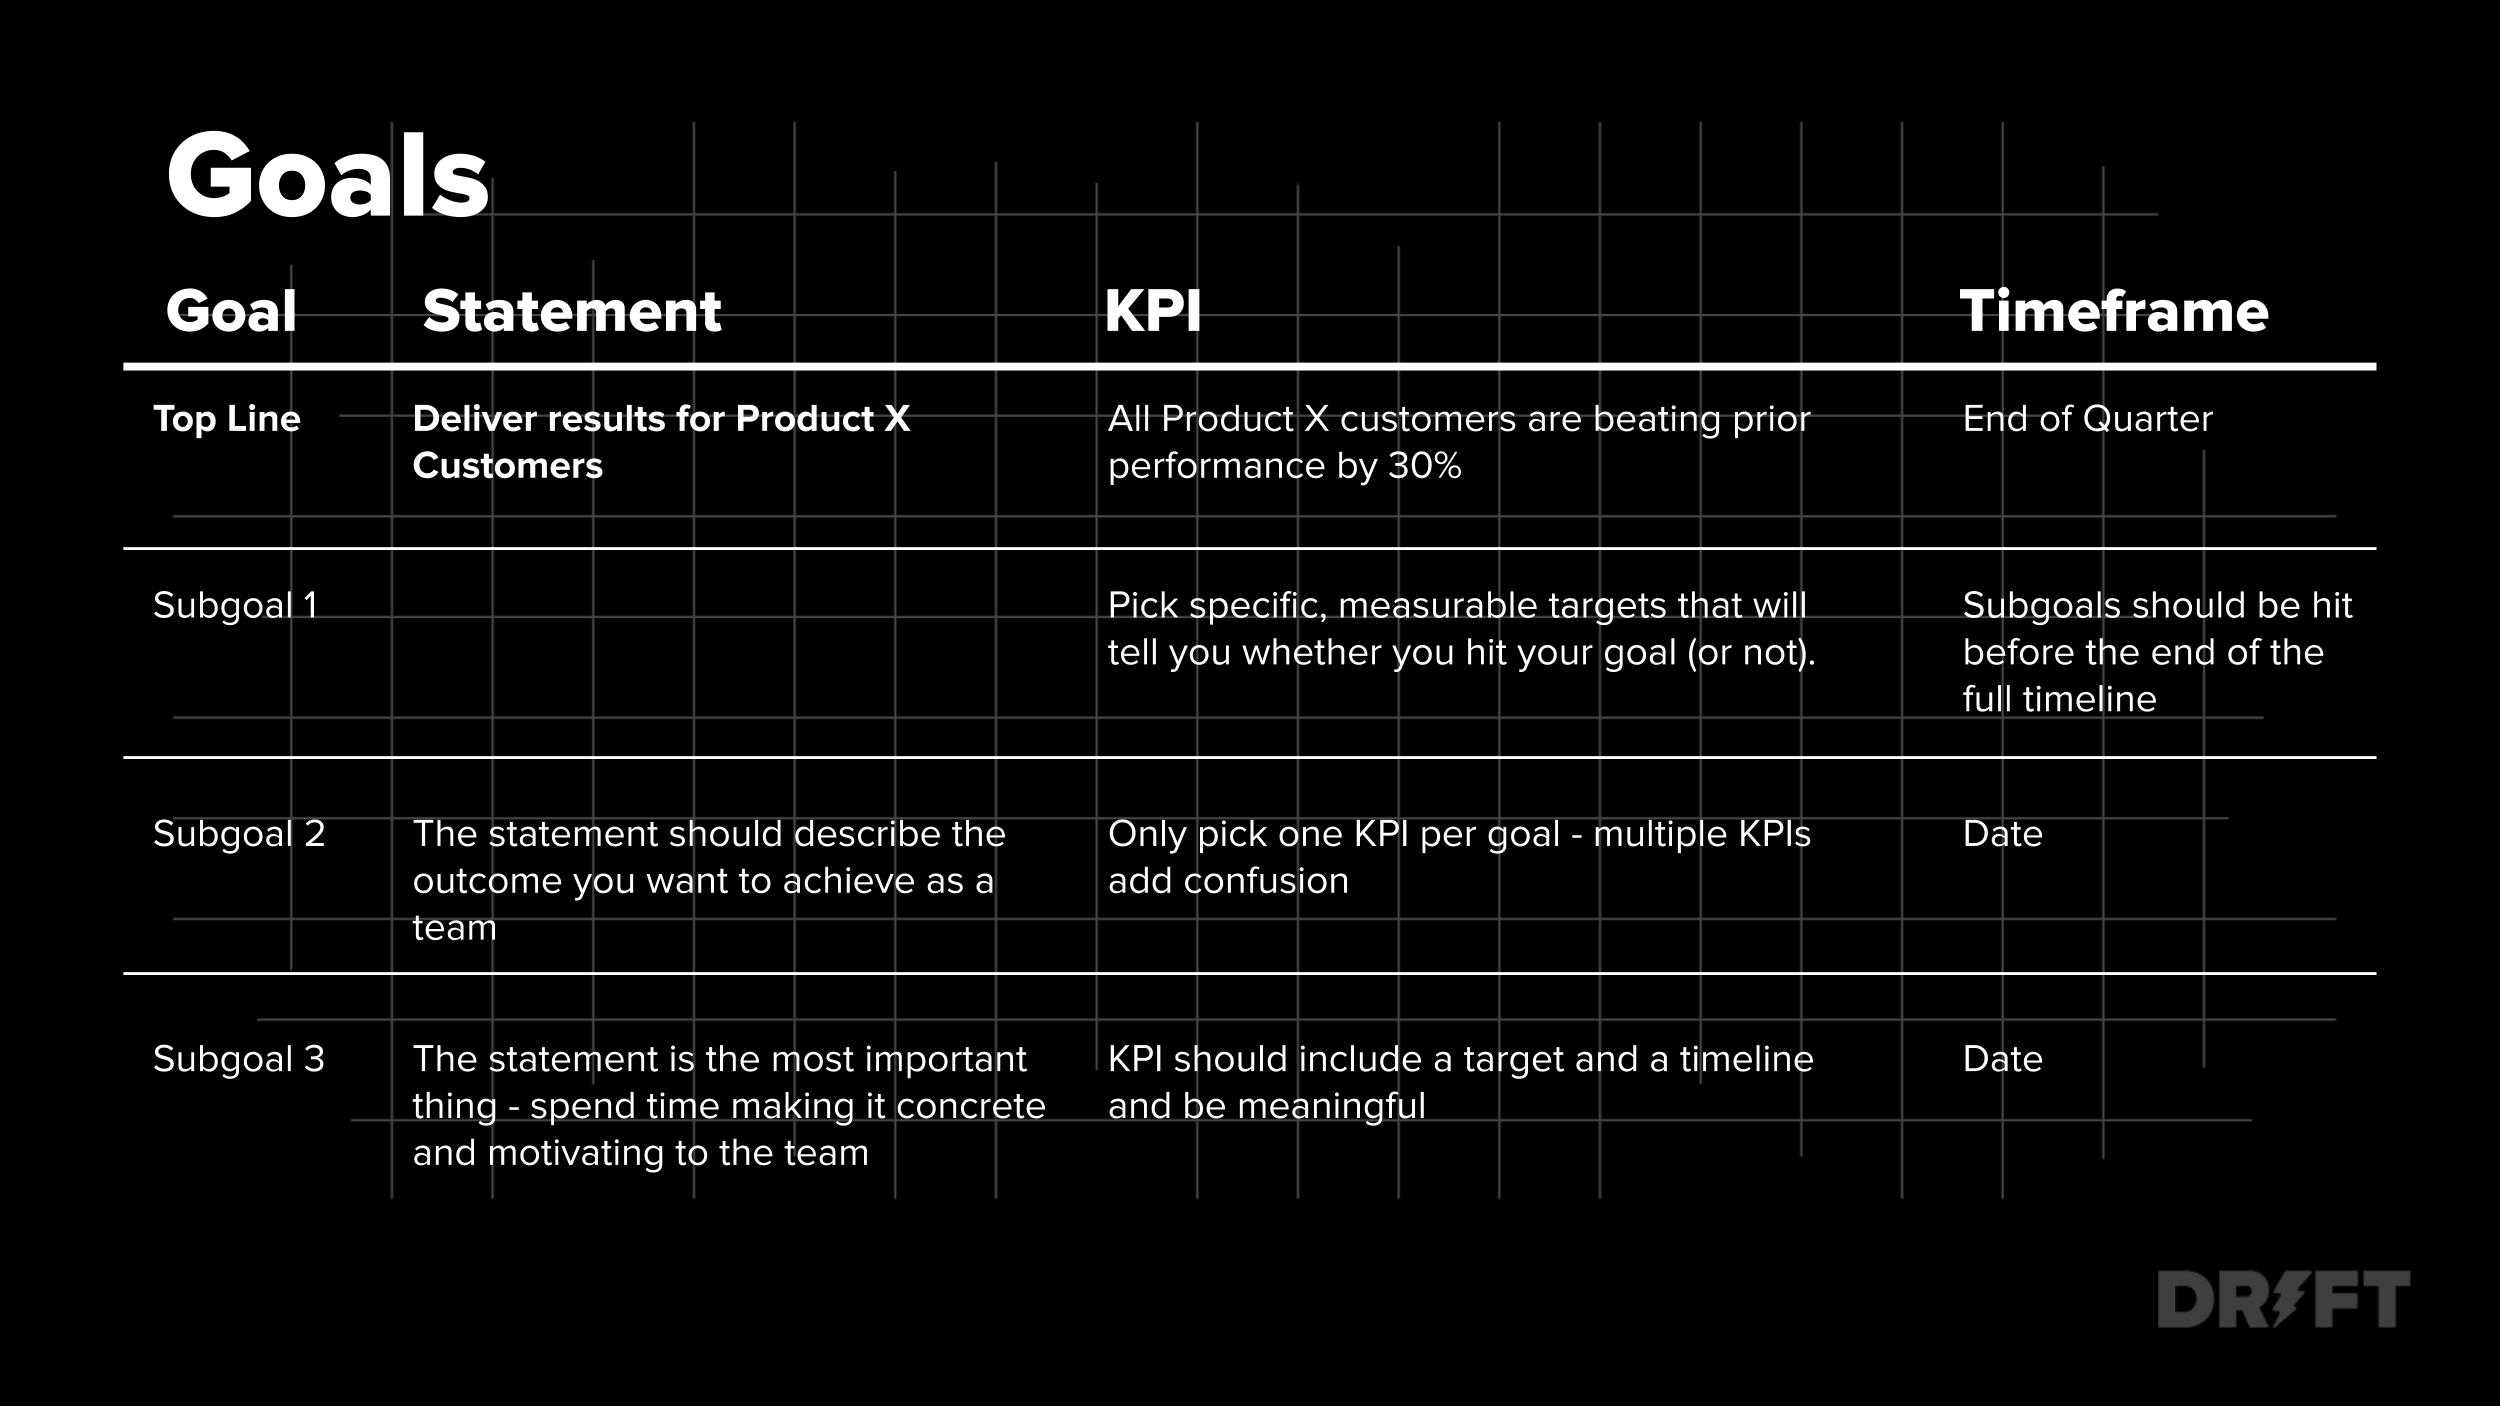
Goals should be challenging, ambitious, with measurable results and a clear owner.
Goals define what will be achieved. They are significant, concrete, action-oriented, and (ideally) inspirational. When properly designed and deployed, goals are a vaccine against fuzzy thinking – and fuzzy execution. Goals are the outcome, not the inputs to the outcome. Make sure you work backward from the goals, not towards them directly.
Each individual goal should be accompanied by a form of measurement (KPI), the name of one directly responsible individual (DRI), and a reasonable but specific deadline.
Key performance indicators (KPIs) help benchmark and monitor the path to goal. Effective KPIs are specific and time-bound, aggressive yet realistic. Most of all, they are measurable and verifiable. The directly responsible individual (DRI) either meets the target KPI’s requirements or they don’t. There should be no gray area and no room for doubt. At the end of the designated period, typically a quarter, a regular check should be completed to grade the goals as fulfilled or not.
Directly responsible individuals (DRIs) help determine who is responsible for the completion of the goal. This may or may not be the person directly completing the task. For example, a manager may be responsible for the completion of goals, but they may delegate a series of tasks to more junior employees to complete.
Pro Tip: Every goal must have a single DRI. When everybody owns it, nobody owns it.
Each goal can be accompanied by subgoals.
Subgoals define what is to be completed in order to complete the larger goal. Each subgoal must also have a clear KPI and one DRI. Subgoals do not have to add mathematically to the primary or “north star” goal, but they should directly impact the primary goal in some way. Here’s another way to think about subgoals. If you don’t hit the subgoals, it should not be possible to hit the big goal.
Example of Goals Table:
Tool #2 – Gaining Visibility into Goals through Visibility Grids
A Visibility Grid (or just “Grid”) is a dashboard that clearly shows how a team is progressing towards their goals. Every goal and subgoal can be displayed as a cell, so that the team can clearly read the progress towards the goal. Grids can have additional rows to show lower goals that contribute to each cell.
Example of Visibility Grid:
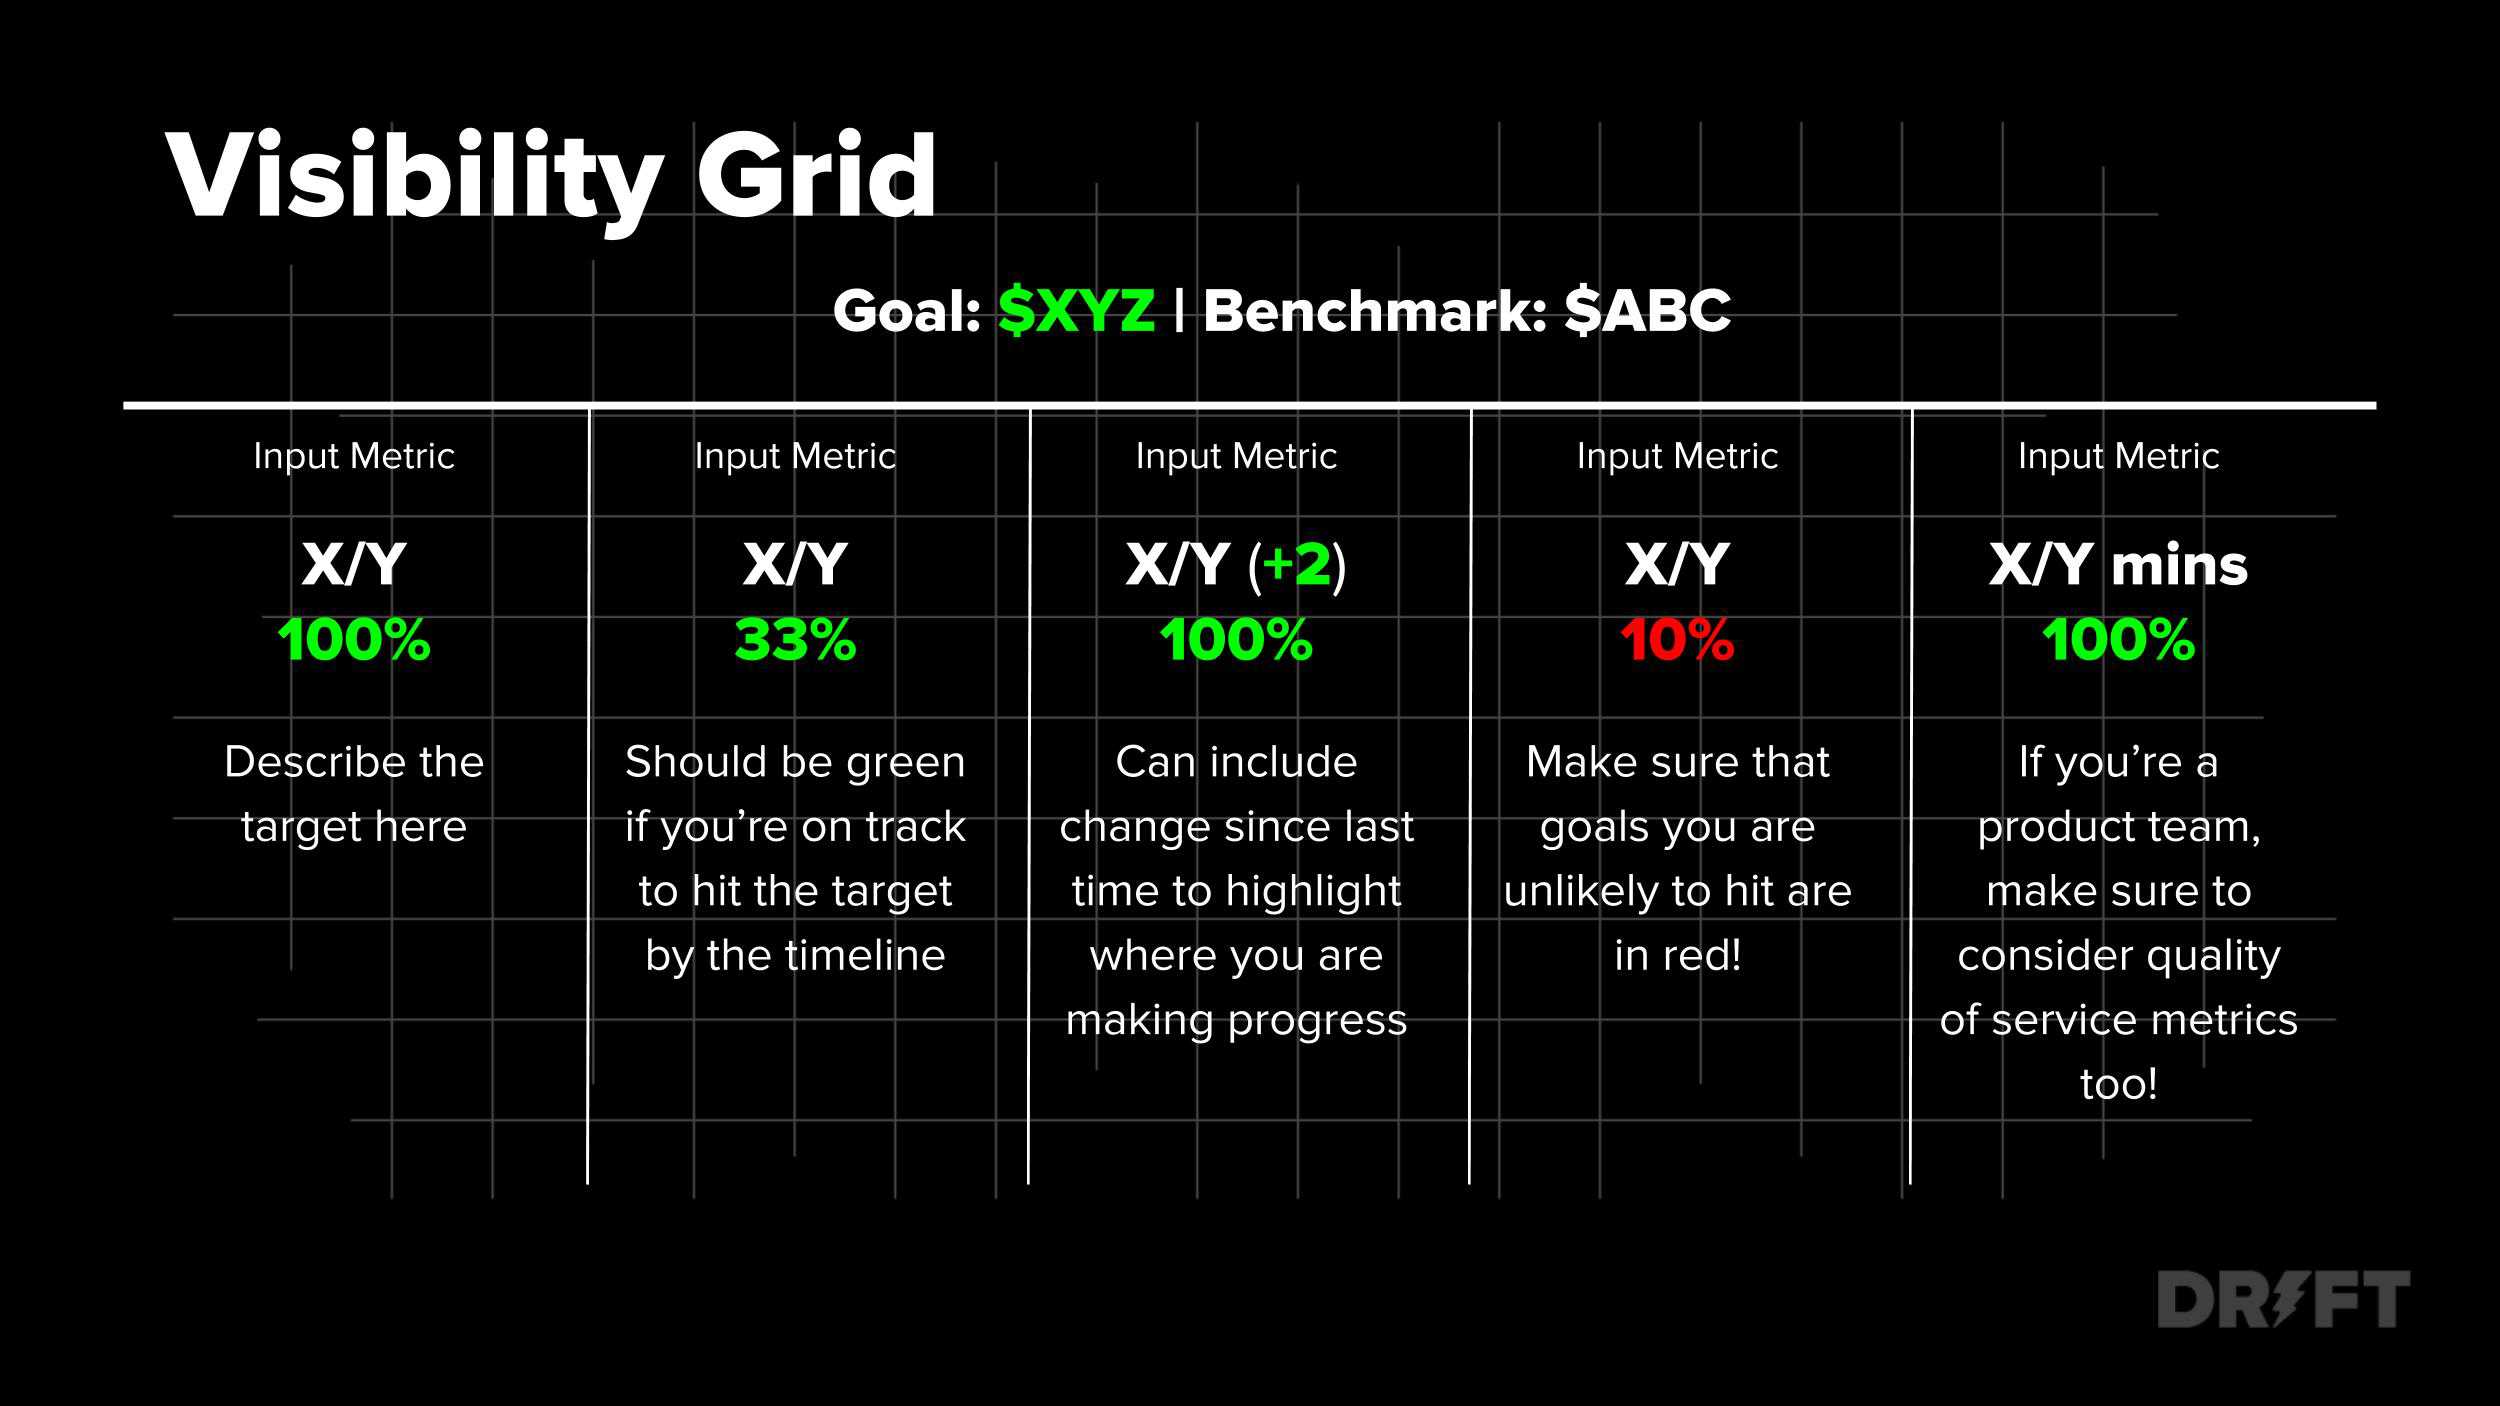
The purpose of visibility grids is to provide a snapshot in time that helps quickly assess if an individual or team is on track to hit, or miss, their goals. Visibility grids must convey the following:
- Absolute current value towards goal
- Percentage to goal
- Pacing towards goal (with color)
- Change in relation to prior time frame (with color)
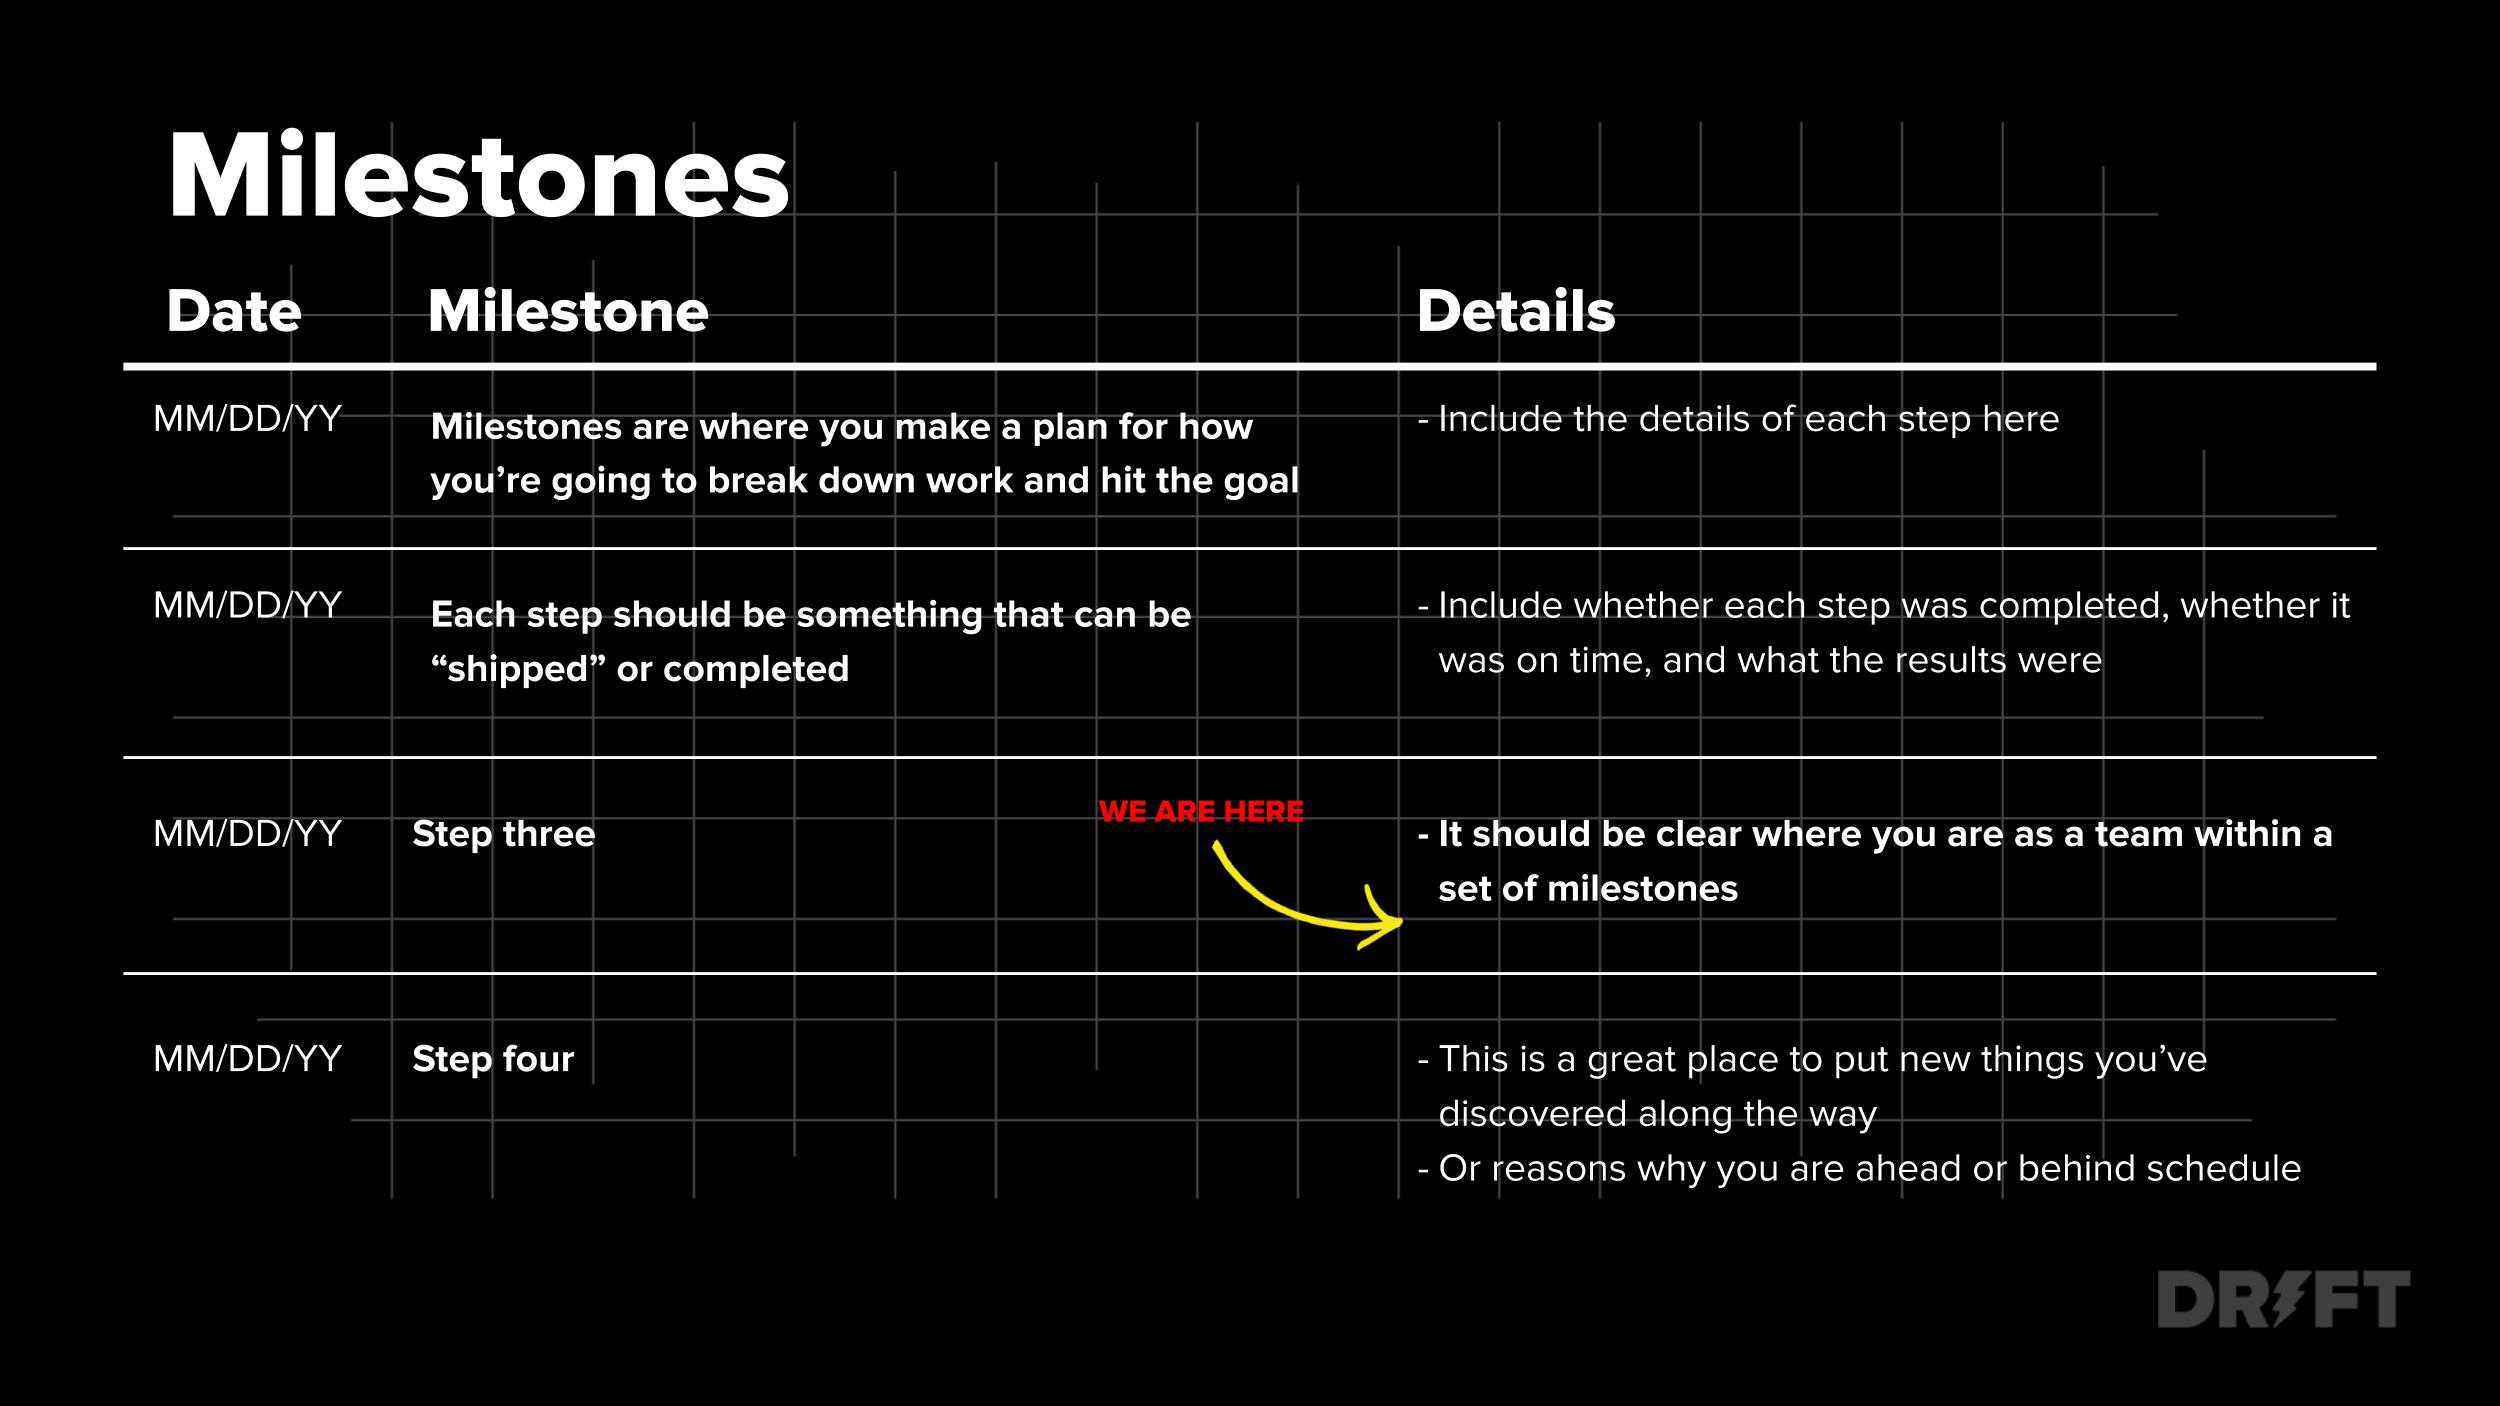
Tool #3 – Laying out the Project Plan with a Milestones Table
Milestones are plans that break larger, ambitious goals down into easier to digest chunks that have to be done in order to hit the topline goal.
Example of Milestones Table:
Tool #4 – Putting Everything into “Motion” with Daily/Weekly Tracking
Motions – in the same way that Grids provide greater visibility into the Goals, Motions provide deeper visibility into the Milestones. What’s the primary difference? Grids are designed to easily show pacing at a moment in time. If it’s red, the subgoal is below pace, and if it’s green, the subgoal is on track.
However, it doesn’t allow a leader to pinpoint the moment in time they fell out of pace. Motions provide this level of visibility. Here is an example.
Example of Motion Table:
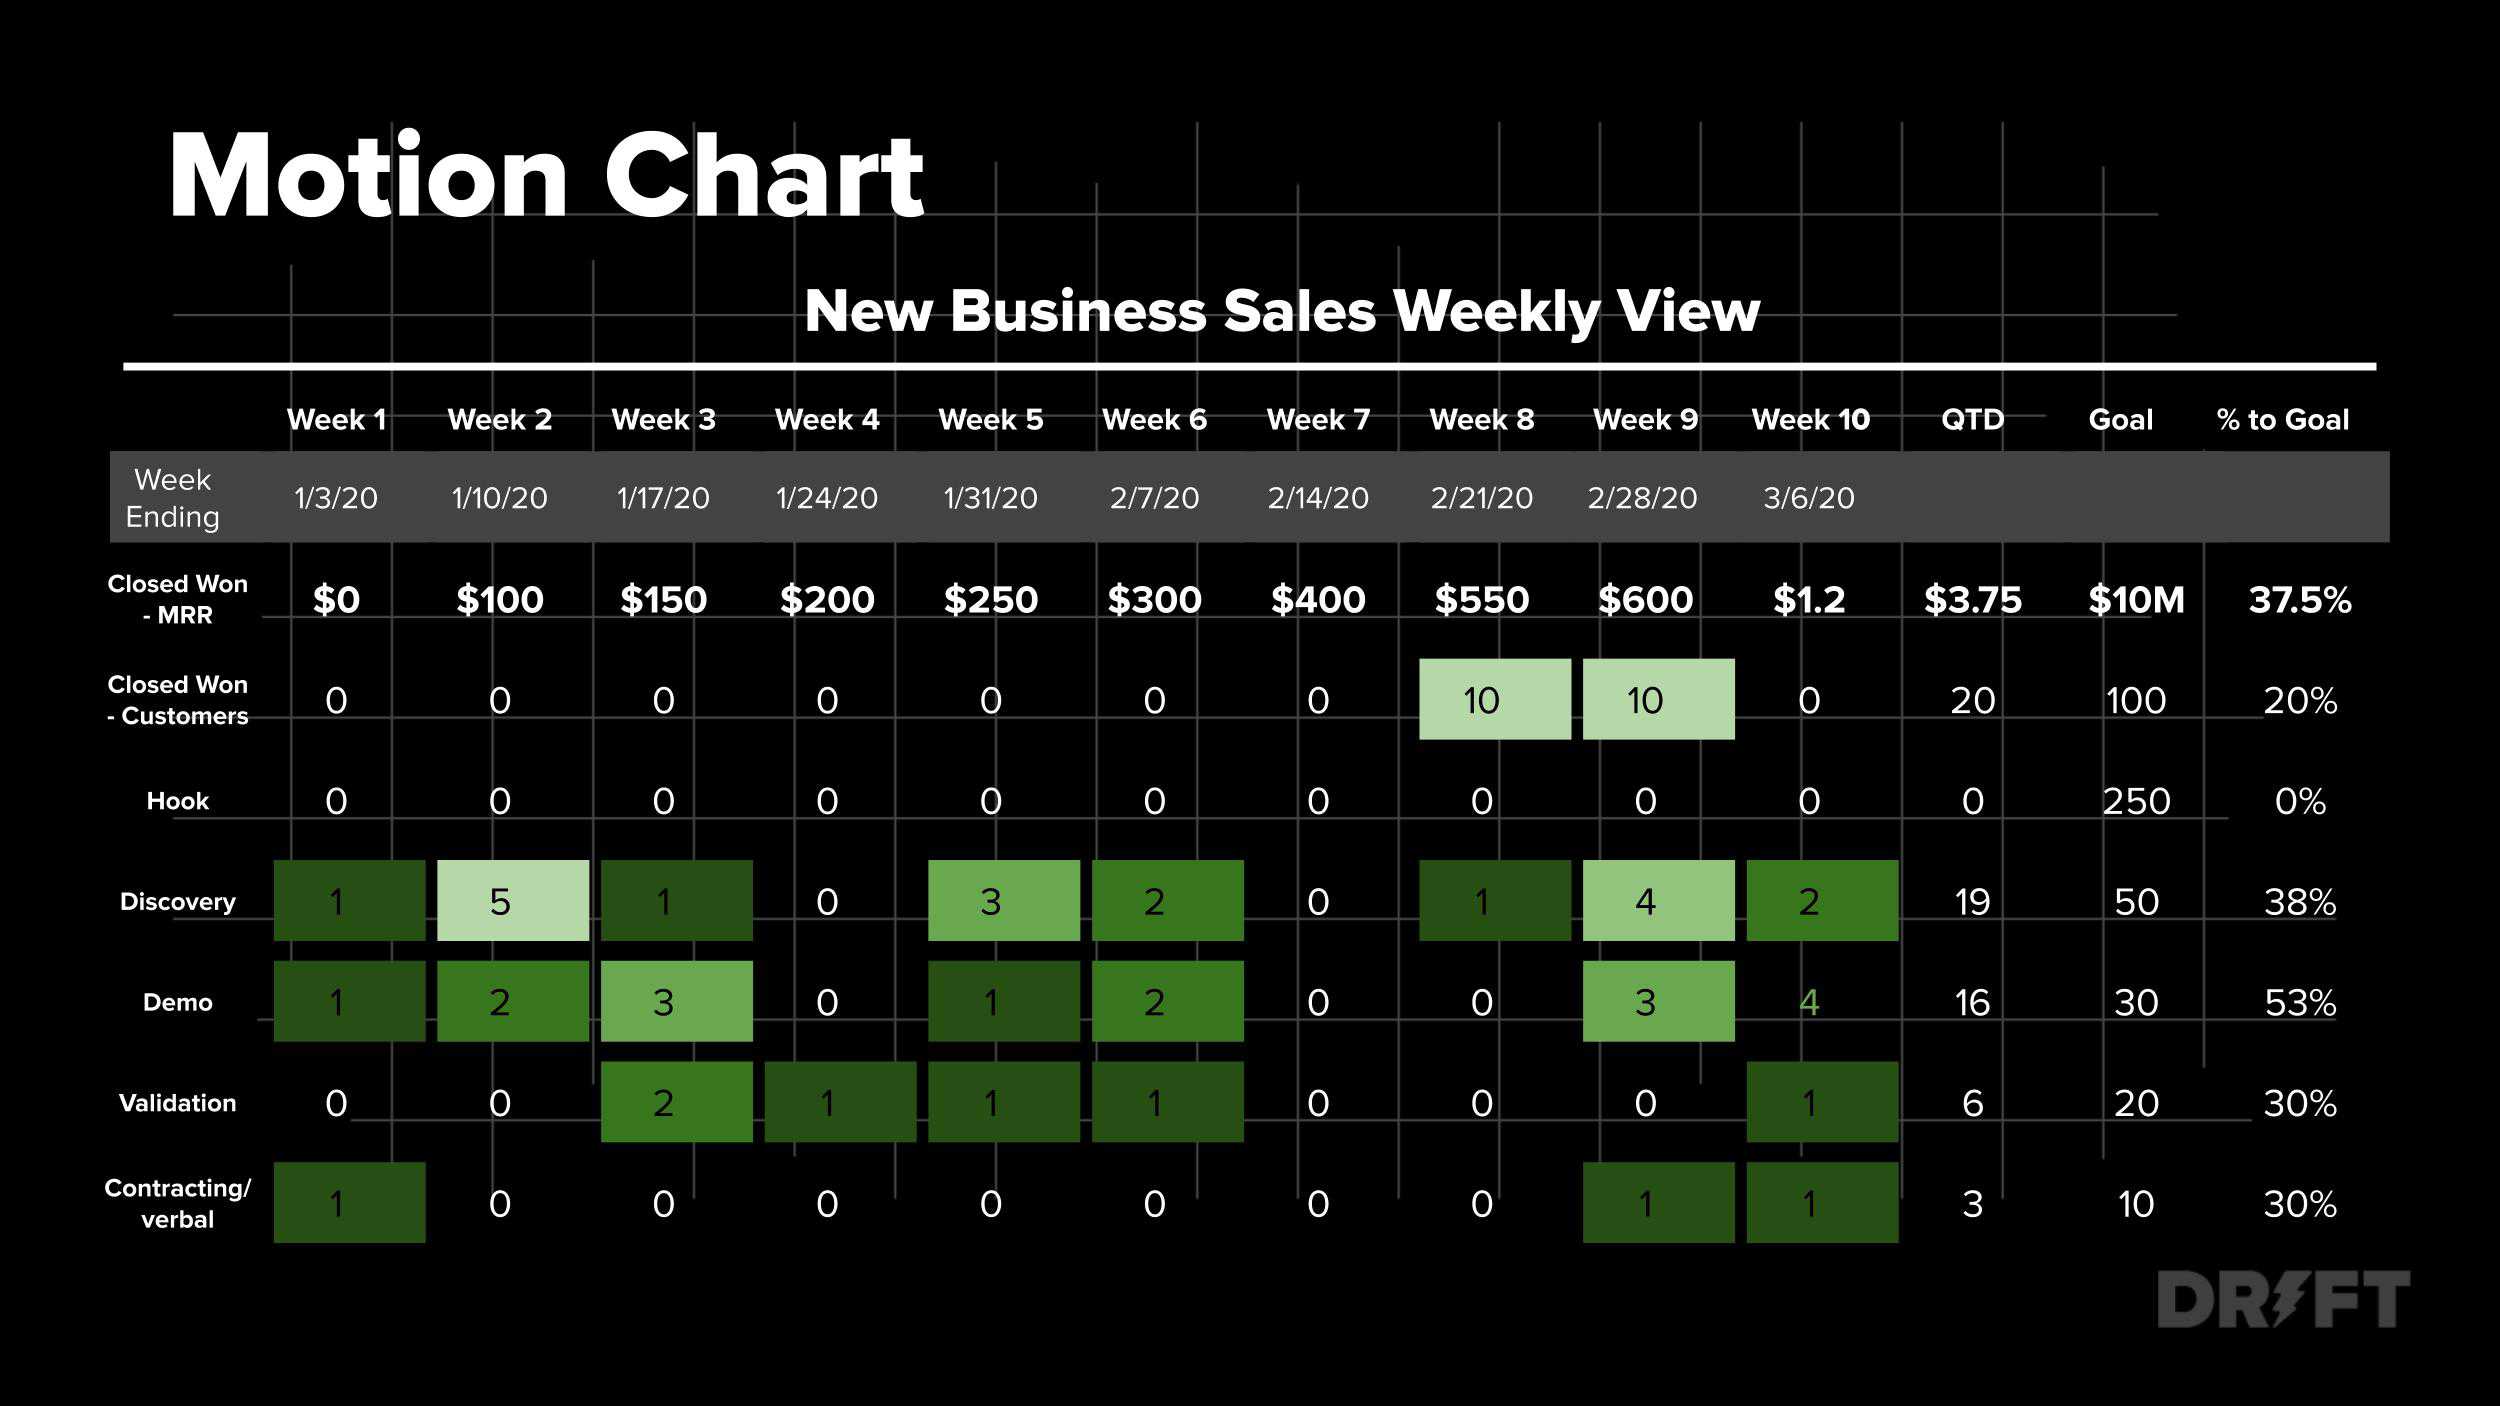
The rows can be a goal, a process, or people. The columns are the pacing unit someone is monitoring: days, weeks, or months. The last 4 columns are standard [QTD, Goal, %, QoQ]. These give a manager or owner the up-to-date total of the combined output from each column.
Who’s with me? Get access to editable versions of our templates here.
I know I’m just scratching the surface on the system and how we use it every day. So if you need more information before diving in, I’ve got you.
Tune into this episode of the Build podcast, where Maggie and I walk you through the system step-by-step.