
If you have customers, chances are high you’ve at least thought about how happy they are — especially if you’re focusing on relationship marketing.
Thinking about it is a good start, but failing to assess it is a huge miss. The return on satisfied customers is high, but the cost of unsatisfied customers can be higher.
Vision Critical created an infographic, “The cost of unhappy customers” that includes some funny math, but the best part about it is the specific story of what one unhappy customer cost United Airlines:
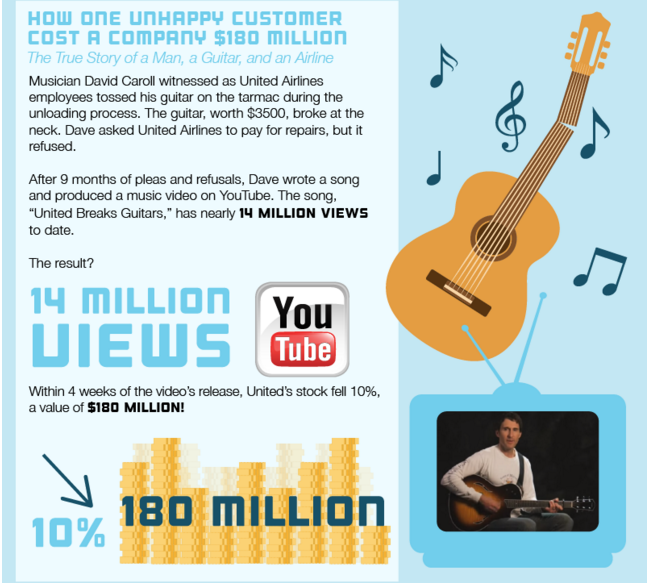
There’s no denying at this point in time that happy customers are profitable, and unhappy customers are a PR nightmare waiting to happen. A $180 million dollar nightmare, in the case of United.
While United made the mistake of not caring about a unhappy customer in a specific situation, many companies fail to make assessing customer satisfaction a priority. I believe this is akin to not caring.
I have a background in market research and survey design dating back to college, and it was put to good use when I spent the first five years of my career at Forrester Research. I’m a fan of a good likert scale as much as the next gal, but I’ve seen too much complexity in customer satisfaction survey design. It needs to be simplified to be effective, and true.
To help you get started today, here are six ways to care about your customer happiness, pros and cons for each, why I believe in NPS.
How To Measure Customer Happiness
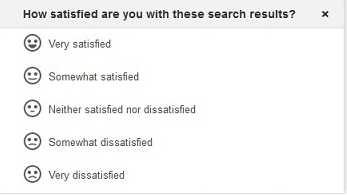
1. Attribute satisfaction: This is a granular way to assess customer satisfaction based on singular features. Here’s an example of Google asking customers how happy they are with search results:
- Pro: This helps a company assess overall satisfaction with individual products. It’s particularly useful if you’re roadmap planning and need to figure out what products to invest in to improve or divest in because they really suck. Trending this data over time is even more powerful.
- Con: In my experience, the devil is always in the details. In this case, the devil is the level of detail you’re asking for. Unless highly compensated, your customers are not likely to make it through a long survey with the level of integrity that you’d like. Another con when assessing individual products is the data becomes bifurcated and each product team takes their piece and decides what to do with it, but at the highest level of the organization, the tough decisions aren’t made (i.e. crappy products get improved on, instead of killed).
2. Expectation vs. perception: This simple question is designed to help a company know if they’ve made good on their promise to their customers. “Does X live up to your expectations?”
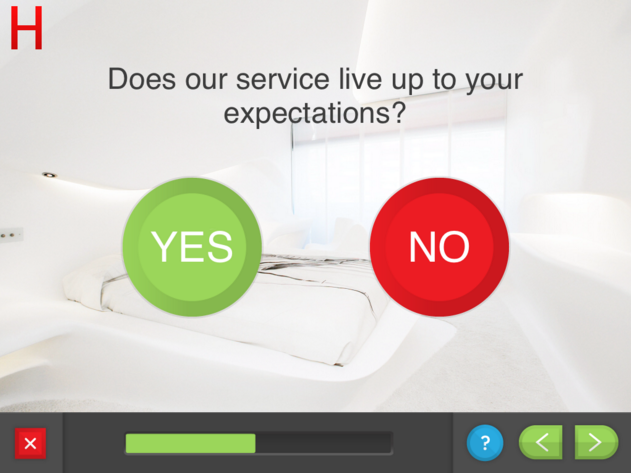
- Pro: Simple yes/no answers are great for increasing the volume of responses category.
- Con: The pro becomes a con because although you “know” one way or another, the binary choice does not leave room for shades of gray. Shades of gray are where you figure out how close you are to great or bad. There’s very little action you can take on this particular question. Further, everyone’s expectations are individual so it’s impossible to say that everyone is on the same rating scale. Further to that, meeting expectations does not have a direct correlation with repeat business. It’s not a good measure to predict someone’s propensity to renew.
3. Things Gone Wrong. Popular in the automotive industry, this is a way to measure success against how many product complaints you receive per unit sold. it’s intriguing because you don’t have to survey to acquire this number. It’s a simple calculation of how many complaints you received for a product by how many units you sold. Your goal is to stay as close to zero as possible. If you have, for instance, a 1… that means there’s a complaint for every single unit sold. Bad news bears.
- Pro: You can assess a negative measure without having to ask a question. It gives clear directional proof that your product is great, or riddled with flaws.
- Con: It’s minimally useful. There’s value in knowing you’re a 1 or 0, but again – shades of gray. For companies who can easily access data clearly classified as a complaint vs. units sold, I think they should pursue this measurement… just know it’ll need to be paired with another customer satisfaction survey measurement to learn how to improve.
4. Intent to return/repurchase: This is a common question intended to capture return intent as a measure of satisfaction.

- Pro: There are some industries where I think this is the best overall measure of satisfaction. Food & Beverage, Hospitality, and Retail, for instance, could use this as the one true measurement because they are a physical location, return business is key, and a customer highly likely to return is also a candidate to make a referral/recommendation.
- Con: If it suits your industry and business, I think this is a great question to ask. But asking it in the wrong industry will leave you with incomplete data. Let’s apply it to a SaaS product, for instance. “How likely are you to return to X product in the next 30 days?” Those that respond very likely are power users, and not likely/at all are on deck to churn. But even your power users aren’t necessarily satisfied… it might be out of necessity that they’re going to return. Always be thinking about understanding why, and how to make the data actionable.
5. Customer Happiness Index (CHI). HubSpot created this new way to measure customer satisfaction. This blog from Evergage is an interview with Jonah Lopin, HubSpot’s former VP of Customer Success (now founder at Crayon), who created the CHI. Basically it’s a three-part satisfaction question and gives the user an option of a sad, neutral, or happy face. Each selection is followed by an open-ended question so they can learn more.
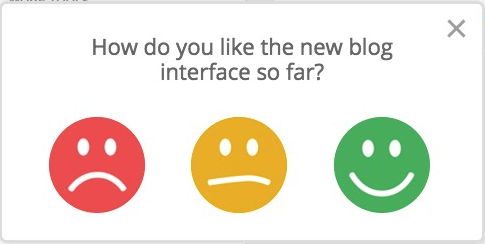
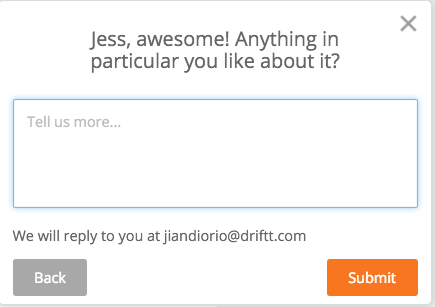
- Pro: It’s pretty badass. It hits all the good criteria. It’s simple, which leads to a high response rate. Because of it’s simplicity, it can be asked often based on attributes/products without being obnoxious. It’s also built into their system in a smart way. You get asked if you’re satisfied with the product you’re currently using. Further, the open-ended follow-up question helps make this data actionable.
- Con: As a HubSpot user, I can vouch for the fact that it is a delight to use. I’ve slogged through Siebel, and then Salesforce.com, and I was shocked by how simple & intuitive it is to use. Does that mean I put up the numbers that justify the investment in the platform? Not necessarily. The challenge with the CHI is I don’t believe it’s a clear indicator of value, but rather, UX delight.
6. Overall Satisfaction/Net Promoter: This is intended to be one simple question that indicates loyalty and intent to renew. It often only uses the company’s name instead of specific products. Trended over time, an organization’s Net Promoter Score can directly be linked to the organization’s performance. As a widely recognized customer satisfaction method, many organizations choose to market their Net Promoter Score to show social proof that their customers are happy.
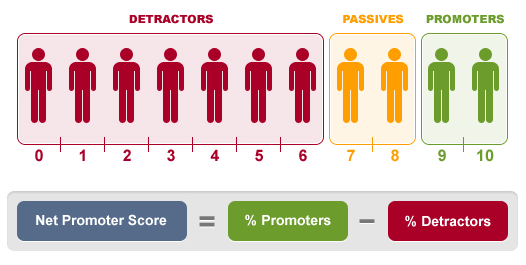
- Pro: The question is beautifully simple and complex at the same time. “How likely are you to recommend X to a friend or colleague?” While many don’t realize it, the word “friend” loads the response with emotional connection to the brand. The word “colleague” assesses its functional benefit. In one question, you assess how much an individual loves your brand, and how much they believe in it’s functionality. The 0-10 scale provides for the shades of gray. With only 9 and 10 being considered a promoter, and 0-6 being a detractor, it gives your customers ample room to be listed as dissatisfied customers. A three or even five-point scale give 1 or 2 options for dissatisfaction respectively. It is hard to have a high Net Promoter score – the bar is extremely high.
- Con: While NPS can be effectively linked to growth, renewal, and overall satisfaction, it can be a bit difficult to action. I separately wrote about how to slightly modify the core question with a follow-up (optional) qualitative question, and then what you should do with the data once you have it.
Drift is a messaging app for marketing and sales. Click here to learn about how Drift can help you grow your business.


