Digital transformation is a blanket buzzword often used to describe, in broad terms, the dynamic impact that technology has had on businesses.
But digital has larger implications. Digital has transformed how people interact in their daily lives, consume content, interpret events, pay their bills, communicate – you name it.
So buzzword or not, there may be no better way to describe the impact digital has had on society other than “transformative” ?♀️
One industry particularly affected by the digital revolution is advertising. As of 2019, digital advertising now accounts for half of the world’s total media ad spend. HALF.
For those in larger economies, digital advertising accounts for more than 60% of all ad spend. According to eMarketer, this trend will only continue to grow in the next few years, with worldwide digital ad spend expected to reach $517.51 billion by 2023.

Source: eMarketer, Global Digital Ad Spending 2019
The rise of digital advertising has encouraged companies both large and small to use new channels to reach buyers.
Today, marketing leaders see the promise of digital advertising as integral to their customer acquisition strategy. However, ask many of these leaders how successful their current digital ad programs are, and you might see a few shifting feet.
That’s because marketing still struggles to implement comprehensive strategies around digital ads – and track the ROI of their efforts. But more than this, they don’t have a model for what success looks like.
To help out, we’ve gathered insights and research on benchmarks for digital marketers struggling to get the most out of their online advertising budget ?
Navigate this article:
What Is Digital Advertising?
Digital advertising is pretty self-explanatory, encompassing a broad range of terms, including paid search, paid display and paid social:
Paid Search
Paid search advertising is where marketers use search engine companies like Google Ads and Bing Ads to create digital advertisements based on SERPs (search engine result pages) and targeted keywords.
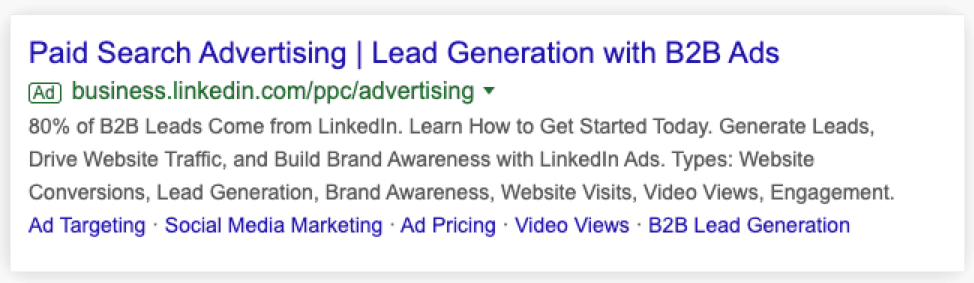
A lot of paid search models use PPC (pay-per-click). This makes it easier for marketers to track the ROI of their digital advertising efforts. This is one of the most common and widely used methods for buying ad space online.
PPC is often used interchangeably with another metric we’ll cover: CPC (cost-per-click). But there is a difference. PPC is a method of advertisement, whereas CPC is the cost associated with an advertisement. G2 had a great way to explain this difference:
“We are running PPC ads on Facebook and are aiming for an average CPC of $0.80.”
Paid Display
The primary difference between search and display advertising has to do with how people find your ad:
- Paid search is useful for people who are typically familiar with your industry, product or line of business. Paid search is specifically tied to keywords and search engines, so your ad is highly relevant to those who find it.
- Paid display is good for generating brand awareness. It is not limited to search and can be displayed across different websites to generate visibility for your brand. In addition, the type of media for paid display varies. That’s because this advertising is traditionally used in retargeting (those ads that follow you across the internet). Paid display ads can be text-based, banners, Gmail inbox messages, etc.
Paid Social
Paid social has become particularly common in B2C industries, but has also gained momentum in B2B as well. As the name implies, paid social refers to advertising displayed on social networks: Instagram, Facebook, LinkedIn, Twitter, and others.
The challenge with paid social becomes strategizing which network makes the most sense for your ad budget. While LinkedIn is often the first thought for B2B companies, increased cost around advertising on the platform has made it less appealing to small- to medium-sized businesses. Facebook and Instagram have become increasingly popular due to their reach, cost-efficiency, and ad-optimized format.
Expect to continue to see more companies investing in paid social. According to the 2020 Digital Advertising Trends report from That Agency, people spend an average of 135 minutes on social media. Per day!
What’s Right For You?
For many companies, the challenge of choosing which of these avenues to take – search vs. display, search vs. social – can be difficult. This has led to a rise in what’s called programmatic advertising.
Programmatic advertising uses automation, and in some cases machine learning, to make decisions around media buying and advertising placement. This method often has guaranteed impressions and can help companies scale their paid ad spend.
Below we see how much companies spent last year on different advertising platforms. Google, unsurprisingly takes the top spot – accounting for more than 30% of worldwide online ad spending.
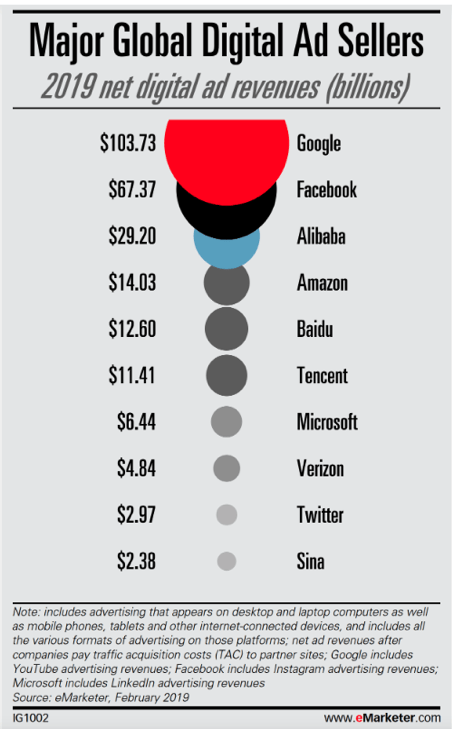
Source: eMarketer, Global Ad Spending 2019
Despite Google stronghold on online ad spending, it is worth noting that Facebook is gaining an upper-hand. Bill King, the SEO & Paid Acquisition Marketing Manager here at Drift, had this to say on the rise of Facebook in the digital advertising world:
“While Google gobbles up much of the ad spend, Facebook has a strong grip on daily active users with its acquisitions of WhatsApp and Instagram. Many marketers are frightened by the vulnerability this poses to their business, as a more concentrated user pool means we’re all more vulnerable to major platform privacy concerns, or even legislative changes as congress becomes more active in user privacy in the U.S.”
As we mentioned, the rise of digital advertising has everything to do with meeting customers where they are. Use this same frame of reference when deciding what makes sense for your advertising strategy. Put in the research first before jumping in!
What Metrics Should I Care About?
There’s a lot of lingo in the digital advertising world. But what are the actual metrics you and your team should concern themselves with? Here’s a quick overview of important terms and definitions that every digital advertising pro should know.
Cost-Per-Click (CPC)
If the payment model for your advertisement is PPC, cost-per-click (CPC) is a metric that is top of mind. This indicates how much you’ll pay per click on an ad. There are a number of factors that go into determining CPC on platforms like Google Ads or Bing Ads:
- Maximum bid
- Ad ranking against competitors
- And quality score (this is used by Google, Bing, and Yahoo; there are a number of factors that go into this as well)
Advertisers want to keep CPC low since it has a direct impact on their return-on-investment (ROI). Like anything in marketing: You want more out of what you put in.
Cost Per Action (CPA)
Cost-per-action, or cost-per-acquisition, is based on activities vs. clicks. For CPA advertisement models, you pay ad hosts a certain fee once a specific action is met. This might be:
- CPA per lead
- CPA per demos booked
- CPA per closed/won opportunity
How this payment is dolled out often depends on the type of goal in mind. For example, generating leads might involve a set price, while generating sales might involve a percentage of the sale.
Cost-Per-Mille (CPM)
Who knew Latin would find its way into the advertising game?
Cost-per-mille, where “mille” means thousand in Latin, refers to the cost incurred per thousand customers who viewed your ad. This is often confused with CPI (cost-per-impression) which is the cost per one potential customer seeing your ad.
CPM and CPI are similar to other traditional advertising models you’re familiar with: TV and radio. The goal of this method is similar to that of TV advertising: visibility. If the goal of your online ad is to get visibility across a digital channel, then CPM might make sense for you.
Click-Through Rate (CTR)
CTR refers to the percentage of people that actually clicked on your ad. This is determined by dividing the number of total clicks and the number of total impressions.
CTR has a direct influence on Google’s quality score. Your quality score then impacts the position of your paid search ad online against others.
Conversion Rate (CVR)
There’s a reason we put “conversion rate” or CVR at the end of this section. That’s because no matter how many clicks you generate, or how many impressions you get, if there’s no impact on your bottom line, none of it really matters.
Simply put, CVR is the average number of conversions per ad. Conversions are actions that you’ve said hold some kind of business value. Business value is defined by you and can be anything from a purchase or closed deal, to starting a conversation.
At a more detailed level, CVR, as defined by Google Ads, is:
“…calculated by simply taking the number of conversions and dividing that by the number of total ad interactions that can be tracked to a conversion during the same time period. For example, if you had 50 conversions from 1,000 interactions, your conversion rate would be 5%, since 50 ÷ 1,000 = 5%.”
CVR is a major sticking point for many digital marketers and can greatly impact their visibility into ROI. That’s because there are two important factors to consider when determining CVR:
- Business value
- The number of conversion actions
Issues arise when marketers fail to define these in a meaningful way across an organization. It is the job of a digital marketer to make these definitions and goals clear to their team and senior management so reporting around digital advertising ROI is accurate.
The Digital Advertising Benchmarks
Earlier we mentioned two important benchmarks in the world of digital advertising:
- Digital advertising spend will only increase: By 2023, global digital advertising spend will reach $517.51 billion.
- Google is king, but Facebook is gaining: Google accounts for more than 30% of all online advertising spend ($103.73 billion as of 2019). Second is Facebook, which generated a little more than half of Google’s net ad revenue in 2019 at $67.37 billion.
To ground the benchmarking information in this section, we’ll focus on industry advertising metrics across these two popular ad networks.
Google Digital Advertising Benchmarks
In 2019, WordStream did a study using Google Ads data to determine the cross-industry benchmarks for CTR, CPC and conversion rates.
Measuring your online ad performance against these benchmarks will give you a better idea of how compelling your ads are against the norm.
Click-Through Rates Benchmarks
WordStream broke down its findings for Google Ads between the Google Search Network (paid search) and the Google Display Network (paid display).
For paid search, the cross-industry average for CTR was 3.17%. For paid display, this number was lower across industries – 0.46%. Knowing what we know about the nature of paid search vs. display, this makes sense.
Paid search ads are directly tied to search terms that someone uses, meaning the content that comes up is more relevant. Paid display ads look to drive brand awareness, meaning most of the ads people see are from companies they may not know, or may not be relevant to the content they are consuming at the time.
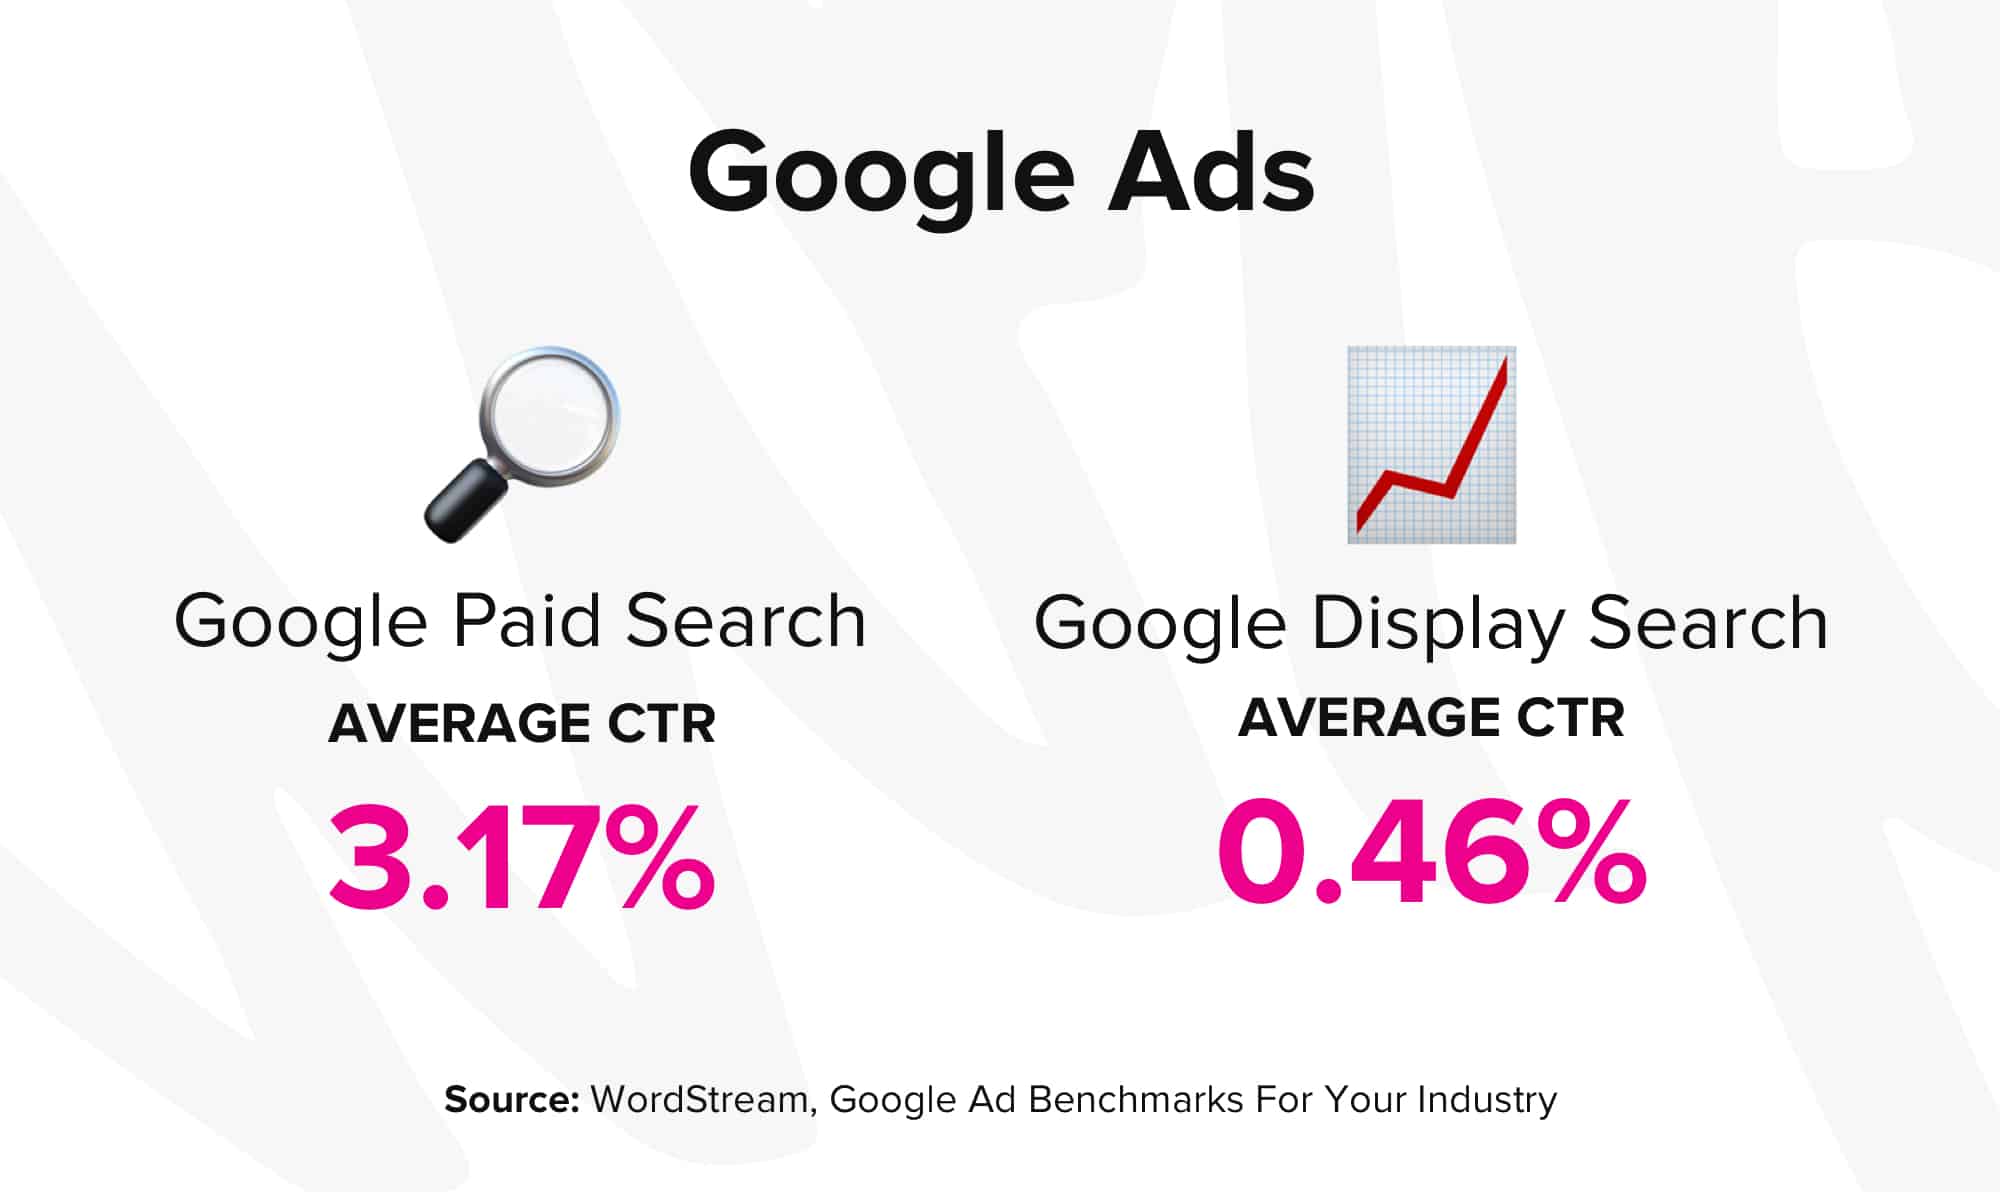
Below we see a graph from WordStream of the average CTR for both Google paid search and paid display across industries.
Dating & personal, travel & hospitality, advocacy, auto, and real estate take the top five spots. While travel & hospitality took a dip in paid display, the others remained in their top positions. Real estate, however, has an incredible lead over other industries in paid display.

Source: WordStream, Google Ad Benchmarks For Your Industry
Cost-Per-Click Benchmarks
Generally speaking, CPC hasn’t increased much over time. Many agree that the ideal paid search CPC lingers around $2.
According to WordStream, the average CPC for paid search is $2.69. While paid display ads keep under a dollar at an average of $0.63 – with one key exception: Dating & personal.
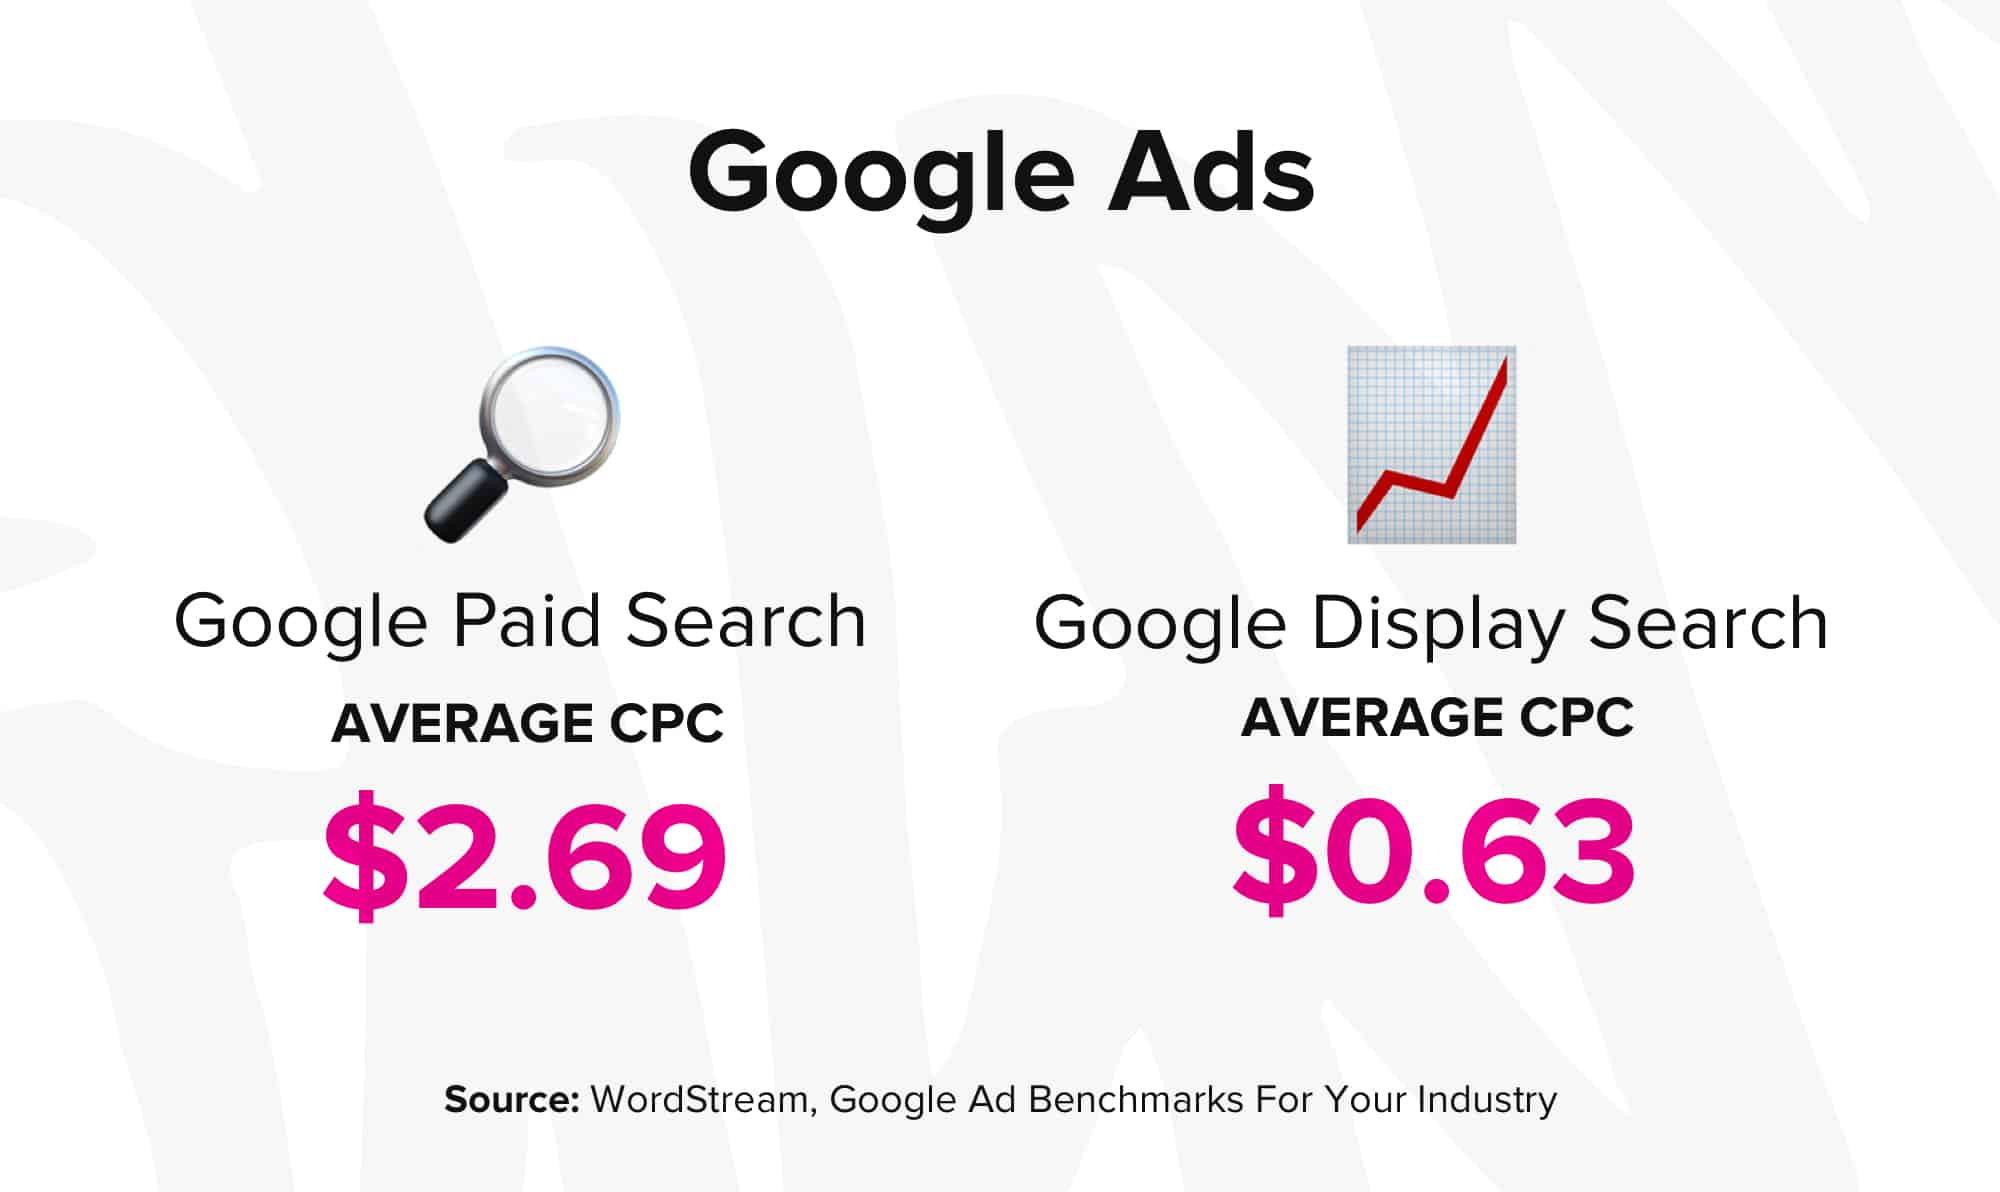
Two industries that completely break the $2 threshold in paid search CPC are consumer services and legal – both of which cross the $6 mark. Looking into some of the most expensive keywords on Google, this adds up. Attorney and Lawyer are some of the most costly keywords on Google.
Conversion Rate Benchmarks
While looking at the industry average for CPC alone may be useful for understanding reasonable ad investments, comparing how CPC stands against average conversion rates offers greater insight into whether these investments are producing ROI.
In the image below we’ve included the average CPC and average conversion rate per industry, side-by-side.
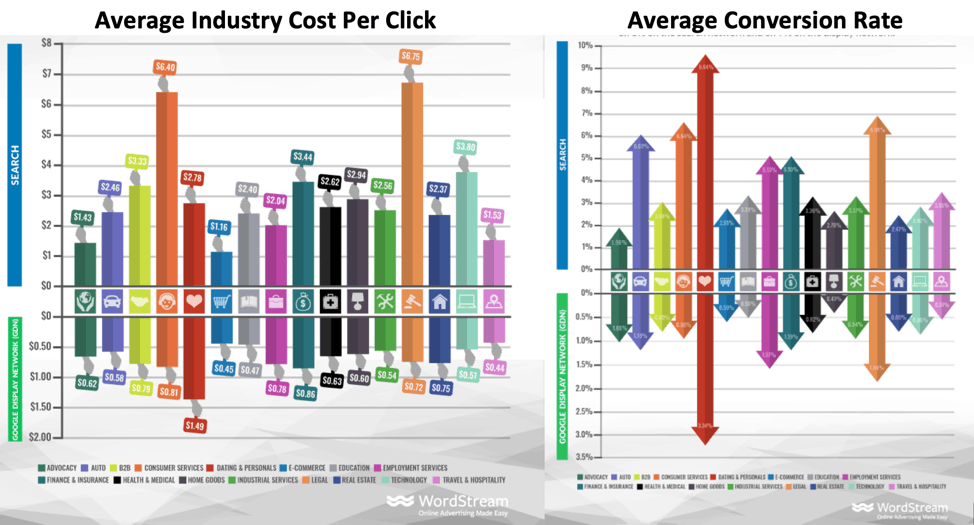
Source: WordStream, Google Ad Benchmarks For Your Industry
Here we see that the companies with the greatest CPC are also seeing the highest return: Dating & personal and Legal. But this isn’t the case across the board. While the ROI for Legal and Dating look good on paper, there are several other factors you need to consider: retention, LTV (lifetime value) and speed to payback.
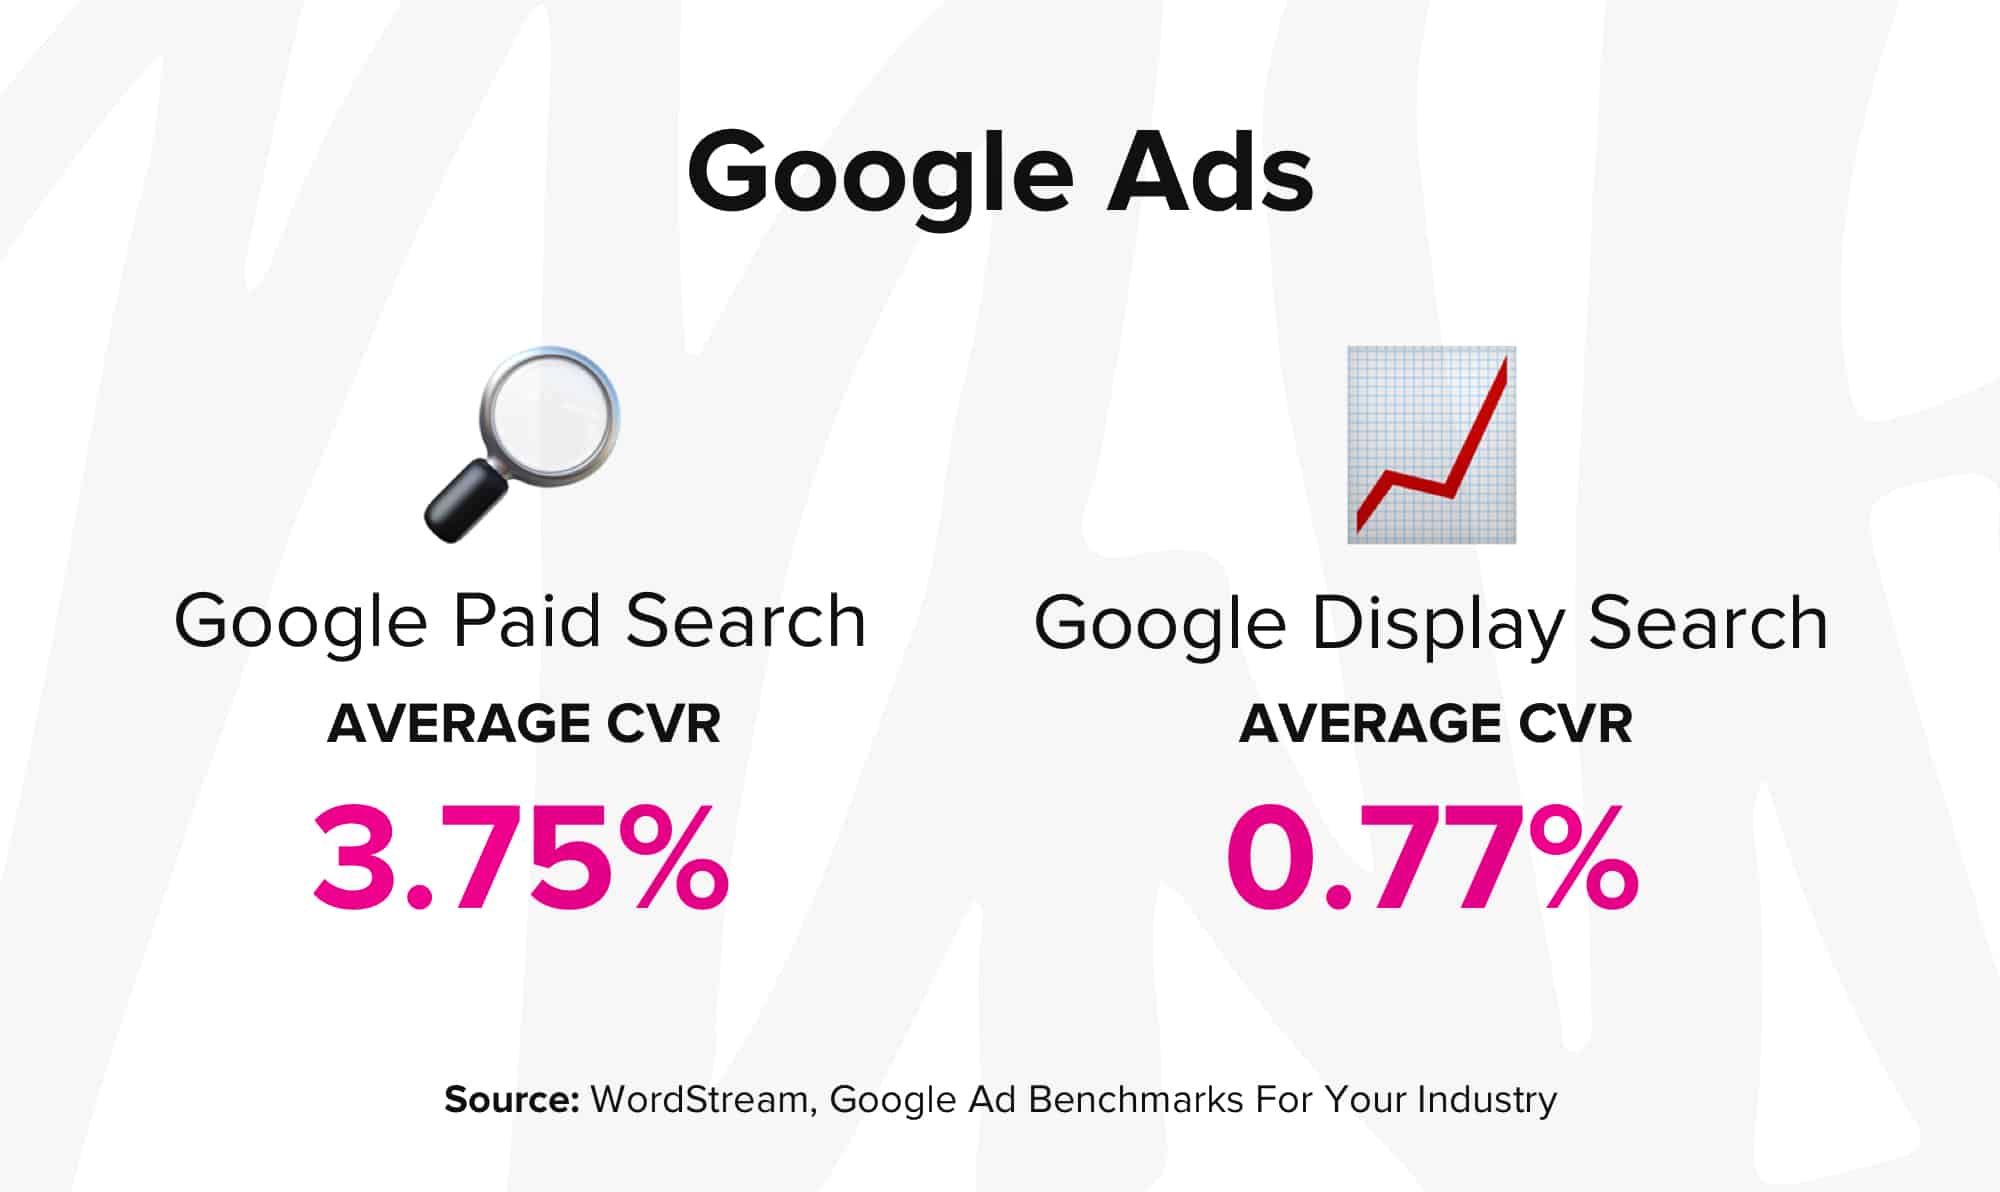
When it comes to digital advertising, experimentation is key. Companies need to understand what offers perform well and adjust accordingly. Overall, the average conversion rate across industries for paid search is 3.75%, while paid display hovers at an average of 0.77%.
Google is the preferred online ad platform for many digital marketers, particularly in terms of paid search. But, as paid social gains momentum, especially with the rise of mobile advertising, this might not always be the case.
Case in point ?
Facebook Digital Advertising Benchmarks
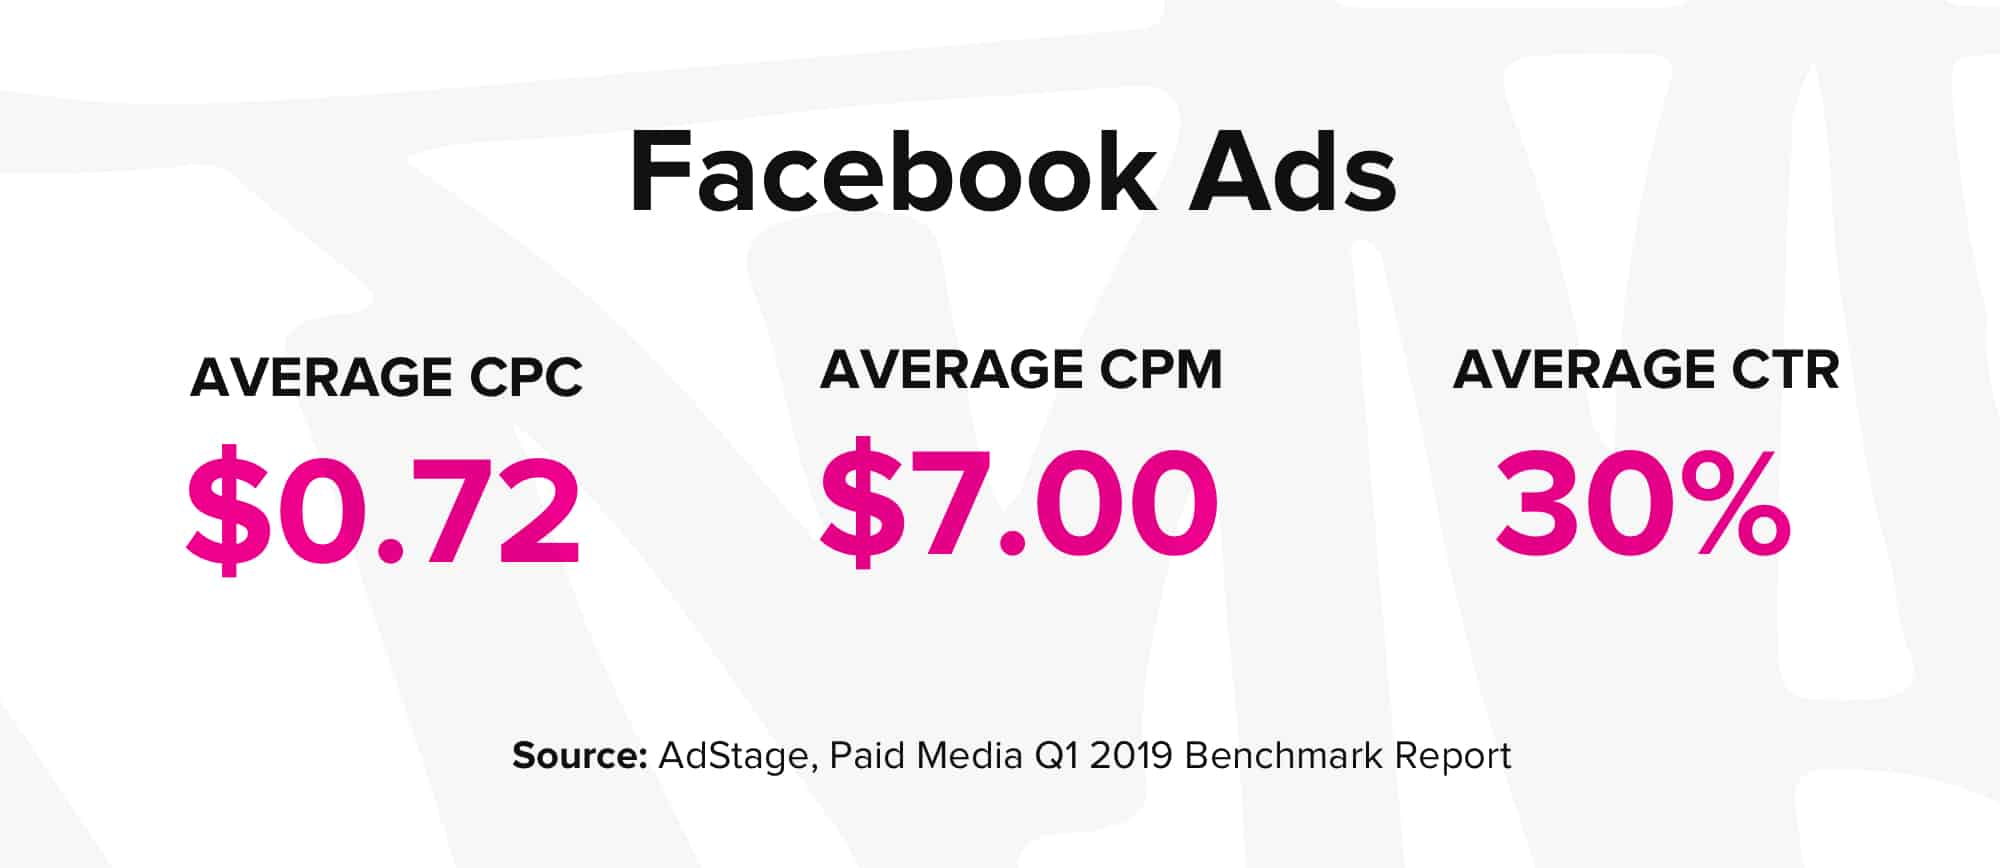
Facebook has become increasingly popular with companies looking for low-cost options and high visibility for their online advertising. Using data from AdStage’s Paid Media Benchmark Report, we’ve broken down the metrics in this section by the three primary advertising channels on Facebook: Audience Network, News Feed, and Messenger.
Unfortunately, Facebook is tight-lipped on conversion rate averages. So, those will be excluded here. But, the Adstage report does include the average CPM (cost-per-mille).
Breakdowns between industries were also not readily available in the AdStage study. Though it did note that cross-industry advertising was not as extensive on Facebook as on Google.
Here’s the current breakdown of average CPC, CPM and CTR across the board between the three Facebook channels mentioned:
Facebook News Feed Benchmarks
The Facebook News Feed is one of the more coveted ad spaces on the social platform for ads and retargeting.
Here’s a breakdown of the averages across industries for digital advertising on the Facebook News Feed:
- CPC: $0.63
- CPM: $8.40
- CTR: 1.33%
Facebook has interesting criteria when it comes to advertising. The best performing ads use bright graphics and little text. In fact, Facebook penalizes for wordy ad copy (both in images and in description text). Keep this in mind when creating your next ad campaign.
Facebook Audience Network Benchmarks
The Audience Network enables digital marketers to extend the reach of their advertising off-Facebook, and includes in-app ads for mobile. Advertisers can still use Facebook’s ad platform to manage these ads, making their ad reach that much more powerful.
Here’s a breakdown of the averages across industries for Facebook Audience Network:
- CPC: $0.72
- CPM: $7.00
- CTR: 0.99%
Facebook Messenger Benchmarks
Advertising within Facebook Messenger is a relatively new medium for the social media giant. However, a few companies have taken the leap and broken into this new territory.
Here are the average metrics across industries for Facebook Messenger:
- CPC: $1.09
- CPM: $6.30
- CTR: 0.54%
Trends To Watch In Digital Advertising
New technologies will continue to disrupt and rewrite the rules of digital advertising. As one of the last sections in this article, let’s explore the current and emerging trends that will impact this space:
- The rise of mobile: Last year marked a first in the world of online search. According to benchmarks from Google Ads, more than 50% of all worldwide traffic now comes from mobile devices. This rise in mobile users has impacted CTR performance on Google. The average mobile CTR for paid search is +0.93% higher than the desktop benchmark. While mobile display ads have around a +0.20% higher CTR. Google has rewarded companies who make their landing pages and copy mobile-friendly. And advertisers have noticed. Between 2016 and 2019, mobile advertising spend increased 2x to $82 billion.
- Programmatic advertising: We mentioned programmatic advertising earlier as a popular method for marketers unsure of how to distribute their ad spend across multiple platforms. But new technology like AI and machine learning only stand to make programmatic advertising more sophisticated – but also potentially more competitive and expensive.
- Native advertising: Advertising spend on native ads has increased steadily over time. People find the look and feel of native ads more helpful and less invasive than traditional pop-up ads or banners. Native ad formats often display as “recommended posts” to follow up relevant content.

- Video: Video has increased in popularity for marketers in terms of both content marketing and campaign management. One of the best examples of this trend is Youtube. Influencers are monetizing their videos by allowing relevantly-placed ads in the video content.
Final Thoughts
Building a comprehensive digital advertising strategy is all about experimentation. To make the smartest decisions for your company, use benchmarks as a baseline around spend and ROI.
One of the most important metrics we mentioned in this article was CVR (conversion rate). This is often the biggest sticking point for marketers who, despite high-performance ads, see little return on their investment.
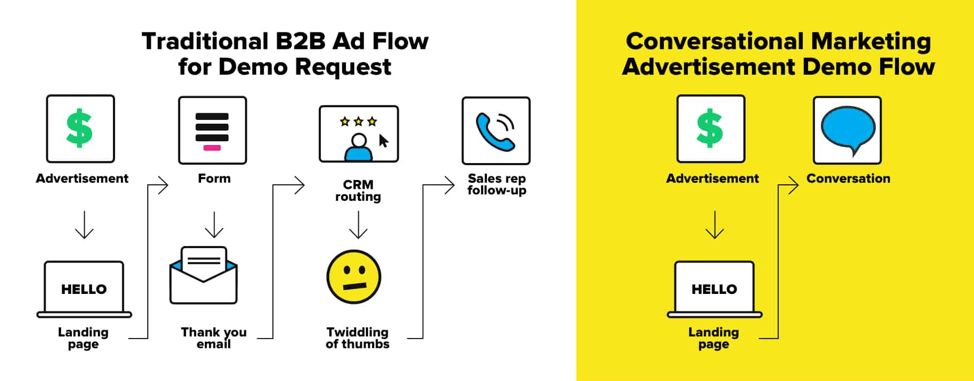
9 times out of 10, the dropoff happens post-click, when potential customers arrive at landing pages that offer little value in return for their data and time. That’s because these pages:
- Aren’t personalized in any way to a customer’s journey
- Use broad messaging
- Require prospects to fill out long forms with little to no information – and then make these people wait a few hours to a few days to get a reply
But some companies have found a solution. To make more of the traffic that’s coming in, they’re using a conversational, personal and real-time approach.